
Trump Debt Default 2025: What’s Actually at Stake
Fears of a Trump debt default in 2025 have repeatedly moved markets, even as the administration insists it will avoid breaching the debt ceiling.
For more background, see the U.S. Treasury’s debt limit page.
Today, the United States stands at a historic crossroads. Despite high levels of income, the country faces a serious problem of excessive government spending. Much of it brings no tangible profit, and it undermines economic stability.
We are living through an incredibly exciting time—a moment of great changes not only in America’s history but in the history of the entire planet. Together, we are witnessing epoch-making events that are rewriting the rules of global economics, technology, and leadership.
In 2025, Donald Trump emerges as the chief architect of reforms aimed at restoring America’s economic strength by reducing wasteful expenditures and strengthening national balance.
Tariffs on European Goods
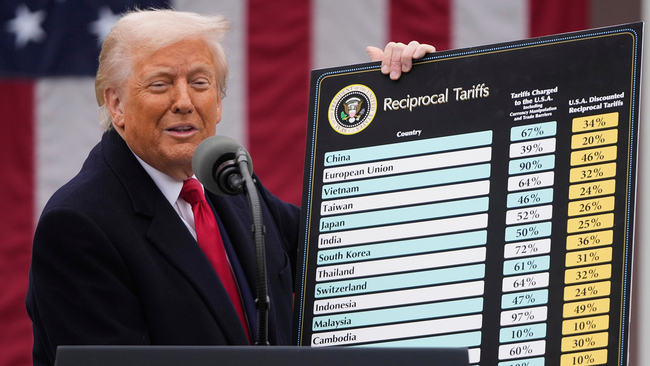
On April 9, 2025, Trump imposed a 20% tariff on all European goods imported into the United States. The trade volume reached an estimated $235.6 billion for 2024. The total EU export to the US reached €531.6 billion in 2025.
However, Trump’s strategy went even further. In March 2025, he approved a unified 10% tariff on all imports and added an extra 20% surcharge for EU goods. As a result, nearly one trillion dollars in trade faced a 30% tariff rate.
Why This Matters:
- European goods became more expensive on the American market.
- The EU found itself in a less favorable position.
- EU exports to the US decreased.
- Inflation in the US temporarily rose.
Trump enacted the largest tariff reform against the EU in history, with effects far surpassing the EU’s targeted countermeasures.
Further Developments: US and China 2024-2025
Brief Summary:
- The US and China maintain the largest trade war.
- Tariffs between them remain high throughout 2024-2025.
Detailed Analysis of US-China Relations in 2024-2025:
- Conflict History (Context)
- 2018-2019: Trump’s administration imposed tariffs on Chinese goods worth around $360 billion, initiating the process of correcting trade imbalances.
- 2020: The two sides signed the “Phase 1” Agreement, but China only partially fulfilled its commitments.
- 2021-2023: The Biden administration maintained tariffs but failed to strengthen economic pressure.
- US vs. China in 2024
- About 66% of Chinese exports to the US remained under tariffs.
Average Tariff Rates:
- 15-25% on consumer goods.
- 25-30% on industrial goods.
- 7.5% on certain agricultural products.
Trade Figures:
- China’s exports to the US: $427 billion.
- US imports to China: $148 billion.
- US trade deficit with China: about $279 billion.
- New Actions in 2025
- Tightened control over high-tech products.
- New tariffs on EVs (+50%), solar panels, batteries, semiconductors.
- “Decoupling” strategy: shifting production to India, Vietnam, Mexico.
- China’s Response
- Maintained tariffs on American agricultural products.
- Stimulated imports from alternative countries.
- Developed the domestic consumer market.
- Financial Outcomes by 2025
- The US-China trade war intensified.
- The US protected strategic industries.
- China responded more softly, trying to minimize losses.
Brief Summary of Tariff Damage 2025
| Country | Potential Damage from Tariffs |
| USA | $80-95 billion/year |
| China | $110-130 billion/year |
Detailed Damage Calculation:
USA:
- Price increases: $45-55 billion/year
- Manufacturer losses: $20-25 billion/year
- Export decline: $10-12 billion/year
- Investment reduction: $5-8 billion/year
China:
- Export drop: $70-80 billion/year
- Loss of access to technology: $30-35 billion/year
- Job losses: $5-8 billion/year
- GDP decline: $5-7 billion/year
Percentage GDP Loss:
| Country | Damage, billion $ | GDP, trillion $ | Loss as % of GDP |
| USA | 80-95 | 28 | 0.28%-0.34% |
| China | 110-130 | 19.5 | 0.56%-0.67% |
Conclusions:
China loses about twice as much relative to its GDP compared to the US.
Final Thought: Trump is building a new American Trade Empire through pragmatic tariff measures.
The History of Tariffs: How the World Played Unfairly Against the USA
The economic history of recent decades shows a clear pattern. Most countries around the world have long imposed high tariffs and hidden barriers against American goods, while demanding open US markets.
- European Union: traditionally imposed high tariffs (up to 20-30%) on US agricultural products, as well as cars, industrial goods, and pharmaceuticals.
- China: actively used hidden barriers: mandatory localization, licensing, quotas, restrictions on foreign investments.
- India, Brazil, Argentina: maintained high tariffs on electronics, automobiles, machinery, and agricultural products.
- Japan and South Korea: preserved hidden barriers through standards, certifications, and quotas.
Why the US Tolerated This for So Long:
- The US was the architect of the post-WWII global order and open markets.
- The US viewed supporting allies’ economic growth as a strategic security measure.
- Over time, however, many countries abused this policy, using protectionism against the US.
What Trump Changed in the Global Tariff System
Donald Trump was the first president in decades to decisively challenge the entrenched unfair international trade system.
Key Changes Initiated by Trump:
- Equal conditions: demanded reciprocal trade terms.
- Universal tariffs: introduced unified tariffs across all imports.
- Strategic protectionism: defended critical industries.
- Negotiation tactics: used tariffs as leverage for fair agreements.
Results:
- Active relocation of manufacturing to the US.
- Increased federal revenue.
- Reduction of trade deficits with several countries.
Intermediate Conclusion: Trump did not destroy the global economy—he began restoring a fair balance in world trade. This move returned the US to its rightful role as the strongest economic leader.
The First Wave of Success and Economic Impact in the USA
Trump’s tariff policies and strategic reforms quickly began to yield tangible domestic results.
Key Positive Changes:
- Job growth: thousands of new manufacturing facilities.
- Increased investments: companies moved operations to the US.
- Budget growth: tariffs bolstered federal revenue.
- Stronger dollar: economic revitalization strengthened the US currency.
- Reduced dependence on China: diversified supply chains.
Concrete Results by the End of 2025:
- Unemployment fell to 3.7%.
- GDP growth reached about 4% for the year.
- Manufacturing sector grew by 5.2%.
- Foreign direct investment increased by 18%.
Trump’s policies structurally strengthened the US economy, making it more self-sufficient, resilient, and attractive for global business.
A New Era of American Strength
We are witnessing one of the most inspiring periods in American history. Thanks to the visionary leadership of Donald Trump and his strategic partnership with Elon Musk, the country is overcoming global economic challenges. At the same time, it is confidently entering a new era of technological, industrial, and financial dominance. Trump restored fairness in global trade, broke the chains of foreign dependency, and encouraged the return of production to American soil. Elon Musk, meanwhile, secured America’s leadership in electric vehicles, space exploration, renewable energy, and advanced communications.
Today, America is not just an economy of opportunities. It is a forge of global innovation, a bastion of industrial power, and a symbol of true independence. While much work remains ahead, the foundation is now in place. Thanks to the strategic actions of Donald Trump and Elon Musk, the United States is boldly moving toward a new golden age. This is an era of prosperity, strength, and technological leadership.
America is becoming great again—in action, not just in words.
And this is only the beginning of a great journey!
Related Reading on Revold Blog
- Pavel Durov: The Man Wanted by Both Moscow and Paris 2026
- Trump — Madman or Master Strategist? How His Policies Will Transform the U.S. Economy, the Global Market, and the Crypto Industry 2025
- ROI, ROE, ROA, ROMI & ROAS — Key Metrics to Evaluate Investment Efficiency
- ROCE, ROIIC, IRR, NPV and EVA — Key Investment Efficiency Metrics
- More Finance analysis on Revold Blog