
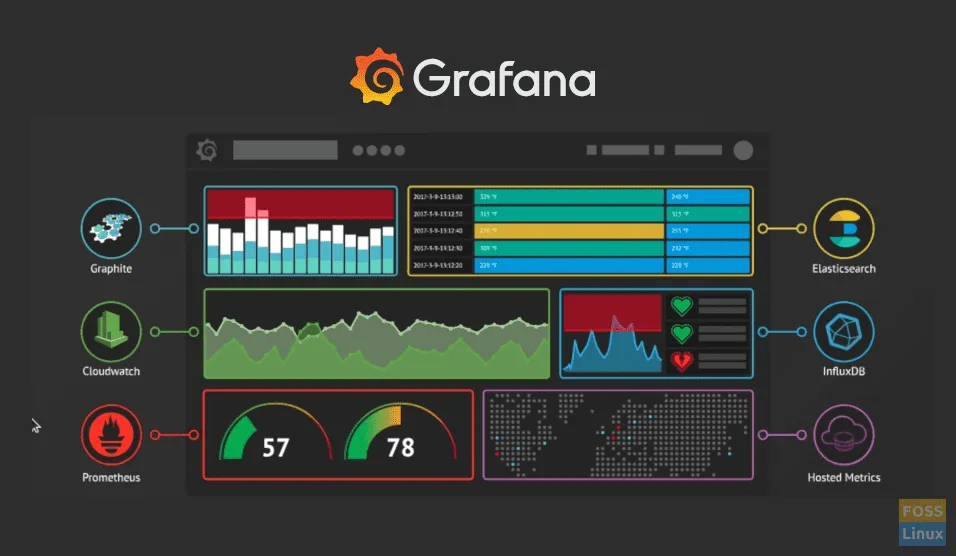
Grafana is an open-source monitoring and observability platform that allows users to create dashboards and visualize data from various sources such as Prometheus, InfluxDB, and Elasticsearch. This guide provides a step-by-step process to install and configure Grafana on CentOS 9, 10, or 11.
Prerequisites
Before proceeding, ensure you have:
- A system running CentOS 9, 10, or 11
- Root or sudo user privileges
- A stable internet connection
Step 1: Update Your System
Before installing Grafana, update your system to ensure all packages are up to date. Run the following command to update package lists and installed software.
sudo dnf update -y
Step 2: Add the Grafana Repository
Grafana is not available in the default CentOS repositories. To install it, add the official Grafana repository by creating a new repository file.
Create a new file at /etc/yum.repos.d/grafana.repo and add the following lines:
[grafana]
name=Grafana
baseurl=https://rpm.grafana.com
repo_gpgcheck=1
enabled=1
gpgcheck=1
gpgkey=https://rpm.grafana.com/gpg.key
sslverify=1
sslcacert=/etc/pki/tls/certs/ca-bundle.crt
Save and exit the file.
Step 3: Install Grafana
Once the repository is added, install Grafana using the dnf package manager.
sudo dnf install grafana -y
Step 4: Start and Enable Grafana Service
After installing Grafana, start the service to make it active.
sudo systemctl start grafana-server
Enable Grafana to start automatically at boot.
sudo systemctl enable grafana-server
To verify that Grafana is running, check the status of the service.
sudo systemctl status grafana-server
Step 5: Configure the Firewall
Grafana uses port 3000 by default. If the firewall is enabled, allow access to this port so you can access the web interface.
sudo firewall-cmd –zone=public –add-port=3000/tcp –permanent
Reload the firewall to apply the changes.
sudo firewall-cmd –reload
Step 6: Access the Grafana Web Interface
Now that Grafana is installed and running, open your web browser and go to the following address:
http://your_server_ip:3000/
Replace your_server_ip with your actual server IP address.
On the login page, enter the default credentials:
- Username: admin
- Password: admin
After logging in for the first time, Grafana will prompt you to change the default password. Set a strong password and proceed.
Step 7: Add a Data Source
Grafana requires a data source to display metrics. To add one:
- Click on the gear icon (⚙️) in the left sidebar and select Data Sources.
- Click Add Data Source.
- Select a data source (e.g., Prometheus, InfluxDB, MySQL, Elasticsearch).
- Enter the required connection details for the selected data source.
- Click Save & Test to verify the connection.
Step 8: Install and Enable Plugins
Grafana supports a variety of plugins. To install the Zabbix plugin, for example, use the following command:
grafana-cli plugins install alexanderzobnin-zabbix-app
After installing the plugin, restart the Grafana service to apply changes.
sudo systemctl restart grafana-server
To enable the plugin, go to the Plugins section in the Grafana web interface, find Zabbix, and click Enable.
Step 9: Create a Dashboard
Once a data source is configured, you can create a dashboard to visualize metrics:
- Click on the + icon in the left sidebar and select Dashboard.
- Click Add new panel.
- Select a query and set Query Mode to Metrics.
- Choose a group, host, application, and item from the drop-down menus.
- Click Apply to add the panel to your dashboard.
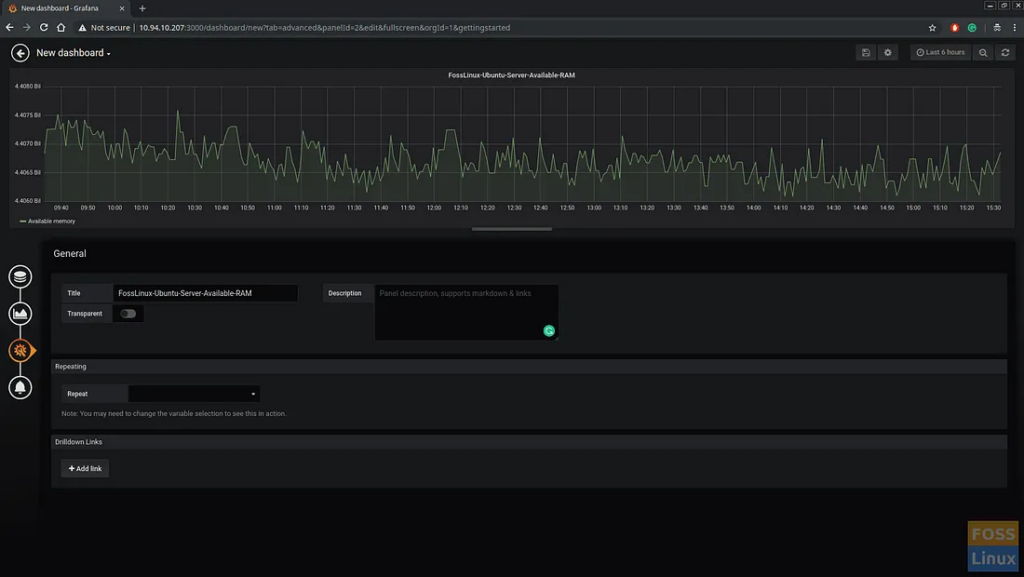
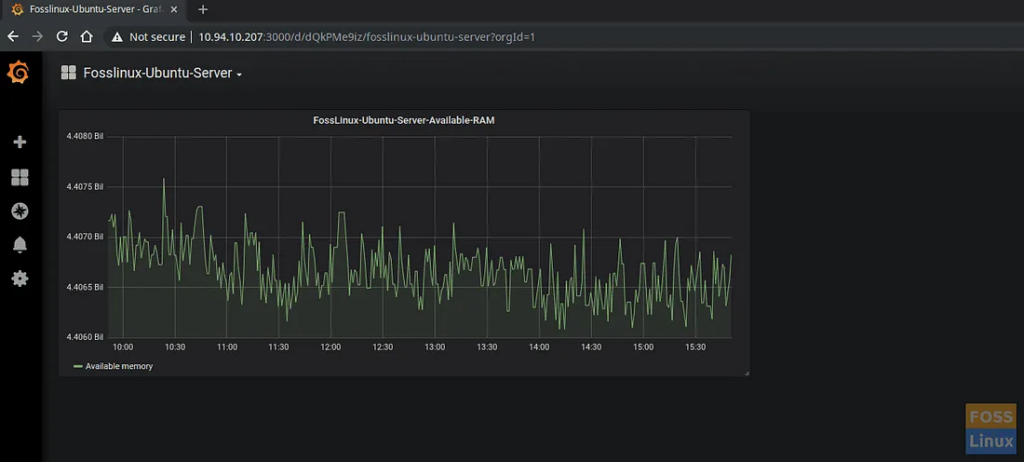
To customize the dashboard, go to the General settings and add a title. Finally, click Save Dashboard.
Step 10: Automate Updates (Optional)
To keep Grafana up to date, you can enable automatic updates using dnf-automatic. Install the package if it is not already installed.
sudo dnf install dnf-automatic -y
Enable automatic updates:
sudo systemctl enable –now dnf-automatic.timer
This will ensure Grafana and other installed packages receive automatic updates when available.
Conclusion
You have successfully installed and configured Grafana on CentOS 9, 10, or 11. With Grafana, you can create interactive dashboards, monitor your system, and integrate multiple data sources.
Next Steps:
- Explore additional Grafana plugins for better functionality.
- Secure your Grafana installation by enabling HTTPS and restricting access.
- Integrate Grafana with monitoring tools like Prometheus or Zabbix for advanced insights.
By following this guide, you now have a fully functional Grafana setup ready for use.