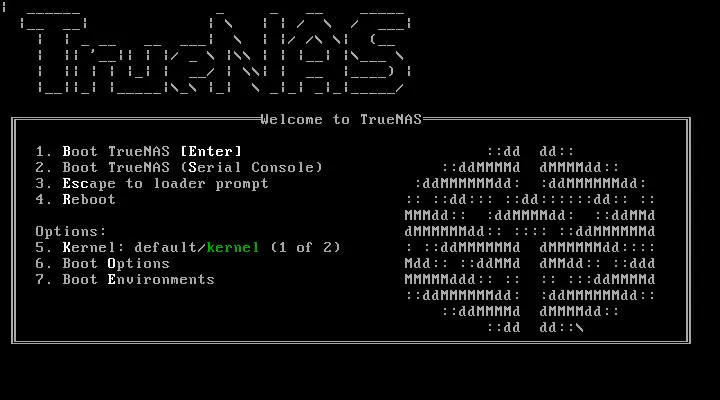
TrueNAS Useful Commands (Updated for 2025)
TrueNAS is a powerful operating system for managing network-attached storage (NAS), built on the ZFS file system. For efficient administration and system monitoring via the command-line interface (CLI), it is useful to know a set of commands that help manage storage pools, disks, and overall system performance.
Important: Using CLI commands can be risky. You are fully responsible for your actions. Always double-check commands before execution to avoid unintended consequences.
ZFS Management
To check the status of all pools, use the command zpool status -v. This will display the current status of the ZFS pool, including any errors or warnings.
To monitor input/output (I/O) operations per second in real time, use zpool iostat 1. This updates every second, providing insights into disk activity.
To list all snapshots, run zfs list -t snapshot. You can filter the results using grep if needed.
For detailed statistics on Adaptive Replacement Cache (ARC), use arc_summary.py or arcstat.py.
To check the ashift value for a specific ZFS pool, use zdb -C your_pool_name | grep ashift. This is important for optimizing performance on SSDs and disks with non-standard sector sizes.
SMART Monitoring
To display help information for smartctl, use smartctl -h.
To show all SMART attributes for a specific disk, use smartctl -a /dev/daX, replacing daX with the actual device name.
If you need a concise list of attributes without additional vendor information, use smartctl -A /dev/daX.
To view the results of recent SMART tests, use smartctl -l selftest /dev/daX.
For historical temperature readings of the disk, run smartctl -l scttemp /dev/daX.
To start a long SMART test, use smartctl -t long /dev/daX. For a short test, replace long with short.
Disk Management
To check GPT identifiers and device names, use glabel status.
To monitor I/O activity on a specific disk with 1-second intervals, use gstat -f daX -I 1000ms.
For general I/O statistics on a disk, run iostat daX.
HBA Card Information
To check the firmware and driver version of HBA cards using the mps driver, run dmesg | grep mps.
UPS Monitoring
To display all attributes of an uninterruptible power supply (UPS), use upsc ups. Replace ups with the actual UPS name if different.
Miscellaneous System Commands
To load the IPMI module, run kldload ipmi.ko.
To view all IPMI sensor values, use ipmitool sensor.
To display CPU load, RAM usage, and disk I/O statistics, use systat -vm.
For BIOS hardware information, use dmidecode | more.
To check system logs, use cat /var/log/messages | more.
For a full system debug report, run freenas-debug -h more /var/tmp/fndebug.
To list all connected devices, use camcontrol devlist.
To view connected USB devices, use usbconfig.
Performance Testing and Stress Tests
To test write speed, use dd if=/dev/zero of=/mnt/tank/tmp.zero bs=2048k count=50k. Ensure that shares and compression are disabled before running this test.
To test read speed, use dd if=/mnt/tank/tmp.zero of=/dev/null bs=2048k count=50k. After the test, delete the tmp.zero file.
To test disk seek and transfer times, use diskinfo -t daX, replacing daX with the appropriate device name.
To stress test the CPU with four threads, run for i in 1 2 3 4; do while : ; do : ; done & done.
Conclusion
The TrueNAS command-line interface provides powerful tools for system administration, monitoring, and troubleshooting. Knowing these commands will help you efficiently manage ZFS storage, monitor disk health, test performance, and diagnose issues.
Always double-check your commands and create backups before making critical changes to your system.


