What is RSI Trading?
RSI (Relative Strength Index) trading is a momentum-based strategy that helps traders identify overbought and oversold conditions in the market. RSI is a widely used technical indicator that measures the speed and magnitude of recent price movements to determine whether an asset is overvalued or undervalued.
Developed by J. Welles Wilder Jr., the RSI ranges from 0 to 100 and is commonly used in stocks, forex, and cryptocurrencies to spot potential trend reversals and momentum shifts.
How RSI Trading Works
1. Understanding RSI Levels
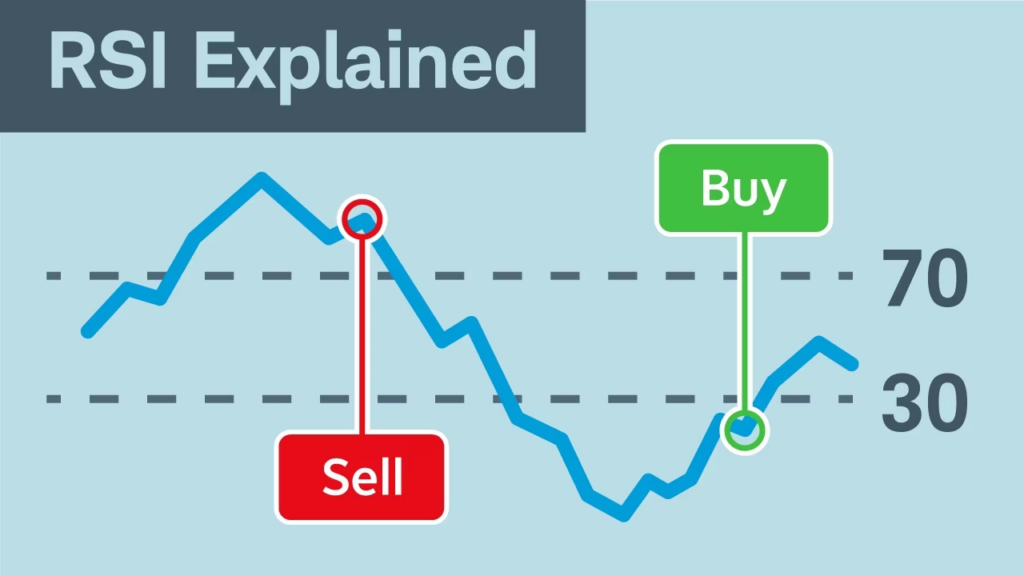
- Above 70: The asset is considered overbought, meaning a price pullback or reversal could be imminent.
- Below 30: The asset is considered oversold, signaling a potential bounce or upward reversal.
- Between 30 and 70: The market is in a neutral state, with no clear overbought or oversold conditions.
2. Trading Strategies Using RSI
Overbought and Oversold Reversal Strategy
- Buy when RSI drops below 30 and starts moving up, indicating a possible price rebound.
- Sell when RSI rises above 70 and starts moving down, suggesting a potential price decline.
- Confirmation signals: Look for bullish or bearish candlestick patterns at RSI turning points.
RSI Divergence Strategy
- Bullish Divergence: When price makes a lower low, but RSI forms a higher low, signaling potential upward momentum.
- Bearish Divergence: When price makes a higher high, but RSI forms a lower high, indicating weakening momentum and a possible sell-off.
- Best used in conjunction with support and resistance levels.
RSI Trend Confirmation Strategy
- Buy when RSI stays above 50 during an uptrend to confirm strong momentum.
- Sell when RSI stays below 50 in a downtrend to confirm sustained bearish pressure.
- Combine with moving averages or trendlines for stronger signals.
3. Setting Stop-Loss and Take-Profit Levels
- Stop-loss: Placed just below the recent swing low (for buys) or above the swing high (for sells).
- Take-profit: Target the next key resistance (for buys) or support (for sells).
- Trailing stops: Can be used when trading RSI-based trend signals.
Example of RSI Trading
Example 1: Buying Bitcoin (BTC) on an Oversold RSI Signal
A trader sees BTC’s RSI drop to 25, indicating an oversold condition.
Trade Execution:
- Entry: Buy BTC at $38,000 when RSI starts rising above 30.
- Stop-Loss: Placed at $36,500 in case the downtrend continues.
- Profit Target: The next resistance at $42,000.
- Exit: BTC reaches $42,000, securing a $4,000 per BTC profit.
Example 2: Shorting Apple Stock (AAPL) on a Bearish RSI Divergence
A trader notices that AAPL is making new highs, but RSI is forming lower highs, signaling weakening momentum.
Trade Execution:
- Entry: Short AAPL at $170 after RSI confirms bearish divergence.
- Stop-Loss: Placed at $175 to manage risk.
- Profit Target: Previous support at $155.
- Exit: AAPL drops to $155, capturing a $15 per share profit.
Pros of RSI Trading
- Effective for identifying momentum shifts – Helps traders enter at optimal price reversals.
- Works across multiple asset classes – Useful in stocks, forex, and cryptocurrencies.
- Simple to interpret – Overbought/oversold levels provide clear trade signals.
- Combines well with other strategies – Works best with support/resistance, moving averages, and candlestick analysis.
Cons of RSI Trading
- False signals in strong trends – RSI can stay overbought or oversold for long periods.
- Requires additional confirmation – Should not be used as a standalone indicator.
- Less effective in sideways markets – Can generate choppy or unreliable signals in ranging conditions.
- Lagging nature – RSI reacts to past price movements and may not always predict future action.
When Should You Use RSI Trading?
- If you prefer momentum-based strategies with clear reversal signals.
- If you want to identify overbought and oversold conditions in various markets.
- If you trade both short-term and long-term timeframes.
- If you can combine RSI with other indicators like MACD, Bollinger Bands, or moving averages.
Final Thoughts: Is RSI Trading Right for You?
RSI trading is an essential momentum strategy for traders looking to capitalize on price reversals and trend shifts. While it is simple to use, traders should always confirm RSI signals with other technical tools to improve accuracy.
For those who want a structured approach to spotting overbought and oversold conditions, RSI trading offers a powerful edge in multiple markets.


