In trading, not all candlestick patterns indicate a clear trend direction. Some patterns signal market indecision, where buyers and sellers are evenly matched, leading to uncertain price action. These patterns often appear before major breakouts, trend reversals, or continued consolidation.
This guide covers seven key indecision candlestick patterns and how traders can interpret and trade them:
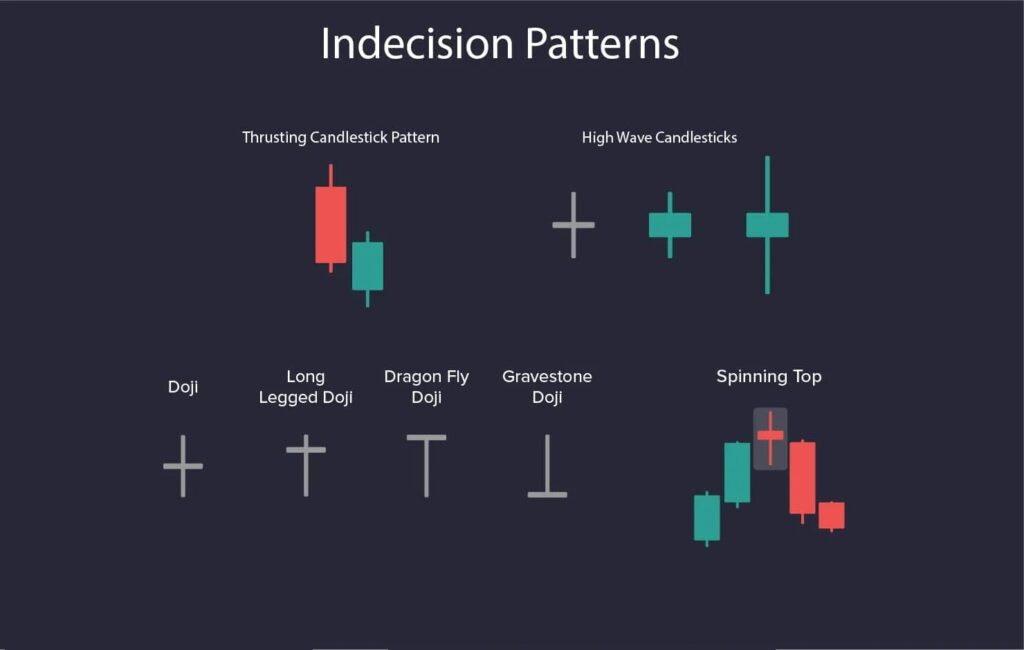
- Doji – Open and close prices are nearly identical, representing market indecision.
- Spinning Top – A small body with long upper and lower wicks, showing uncertainty.
- Inside Bar – A small candle completely contained within the previous candle’s range, signaling consolidation.
- Marubozu – A candle with no wicks, indicating strong directional momentum.
- Long-Legged Doji – A Doji with long wicks, indicating high market volatility and uncertainty.
- Gravestone Doji – A Doji with a long upper wick and no lower wick, signaling potential bearish reversal.
- Dragonfly Doji – A Doji with a long lower wick and no upper wick, signaling potential bullish reversal.
By the end of this article, you’ll understand how to identify, confirm, and trade indecision patterns effectively.
1. Doji: A Sign of Market Hesitation
What is a Doji?
A Doji is a candlestick where the open and close prices are nearly identical, forming a small or nonexistent body. It signals market indecision as neither buyers nor sellers can dominate.
Why Does It Form?
The pattern occurs when buying and selling pressures are balanced, preventing a strong price movement in either direction.
How to Trade It?
- Confirmation: The next candle must confirm the direction (bullish or bearish).
- Entry: Enter a trade after a strong breakout from the Doji’s range.
- Stop-Loss: Set below or above the Doji’s wicks.
- Target: The next support or resistance level.
2. Spinning Top: A Small Body with Large Wicks
What is a Spinning Top?
A Spinning Top has a small real body with long upper and lower wicks, indicating that buyers and sellers both attempted to push the price, but neither could maintain control.
Why Does It Form?
It signals uncertainty after a strong trend, suggesting a potential trend pause or reversal.
How to Trade It?
- Confirmation: Look for the next candle to determine direction.
- Entry: Trade only if a strong breakout occurs.
- Stop-Loss: Below or above the Spinning Top’s wicks.
- Target: Next key price level.
3. Inside Bar: A Pattern of Consolidation
What is an Inside Bar?
An Inside Bar is a small candle that is completely contained within the range of the previous candle, indicating market consolidation.
Why Does It Form?
It represents a pause in momentum, often leading to a strong breakout in either direction.
How to Trade It?
- Confirmation: Wait for a breakout above or below the Inside Bar’s range.
- Entry: Enter once price moves beyond the high or low of the Inside Bar.
- Stop-Loss: Set near the opposite end of the Inside Bar’s range.
- Target: Project the breakout distance based on previous trend strength.
4. Marubozu: A Candle with No Wicks
What is a Marubozu?
A Marubozu is a candlestick with no wicks, meaning the price opened at one extreme and closed at the other.
✔ A Bullish Marubozu opens at the low and closes at the high.
✔ A Bearish Marubozu opens at the high and closes at the low.
Why Does It Form?
It indicates strong directional momentum where one side (buyers or sellers) is completely dominant.
How to Trade It?
- Confirmation: A continuation in the same direction after the Marubozu confirms strength.
- Entry: Enter in the direction of the Marubozu’s close.
- Stop-Loss: Below or above the Marubozu’s range.
- Target: Based on recent price action or trend strength.
5. Long-Legged Doji: Extreme Volatility and Indecision
What is a Long-Legged Doji?
A Long-Legged Doji has long upper and lower wicks with a tiny body, showing that price moved significantly in both directions but closed near its open.
Why Does It Form?
It signals high volatility and strong market indecision, often occurring before major breakouts.
How to Trade It?
- Confirmation: The next candle must confirm direction.
- Entry: Trade only if a strong trend emerges after the pattern.
- Stop-Loss: Set near the Long-Legged Doji’s high or low.
- Target: The next key support or resistance level.
6. Gravestone Doji: A Bearish Reversal Signal
What is a Gravestone Doji?
A Gravestone Doji has a long upper wick and no lower wick, closing near its open price.
Why Does It Form?
It shows that buyers pushed prices higher, but sellers took control and forced prices back down, signaling a potential bearish reversal.
How to Trade It?
- Confirmation: A strong red candle after the Gravestone Doji confirms the reversal.
- Entry: Enter a short position below the Gravestone Doji’s low.
- Stop-Loss: Above the wick’s high.
- Target: Next support level.
7. Dragonfly Doji: A Bullish Reversal Signal
What is a Dragonfly Doji?
A Dragonfly Doji has a long lower wick and no upper wick, closing near its open price.
Why Does It Form?
It indicates that sellers pushed the price lower, but buyers regained control and forced the price back up, signaling a potential bullish reversal.
How to Trade It?
- Confirmation: A strong green candle after the Dragonfly Doji confirms the reversal.
- Entry: Enter a long position above the Dragonfly Doji’s high.
- Stop-Loss: Below the wick’s low.
- Target: Next resistance level.
Final Thoughts: Mastering Indecision Patterns
Understanding indecision candlestick patterns helps traders anticipate potential breakouts, trend reversals, or trend continuations. However, for maximum accuracy, traders should:
✔ Wait for confirmation before entering a trade.
✔ Use volume analysis to validate breakouts.
✔ Combine indecision patterns with support, resistance, and trend indicators for stronger signals.
By mastering these seven indecision patterns, traders can make smarter, more confident trading decisions based on market sentiment and price action.


