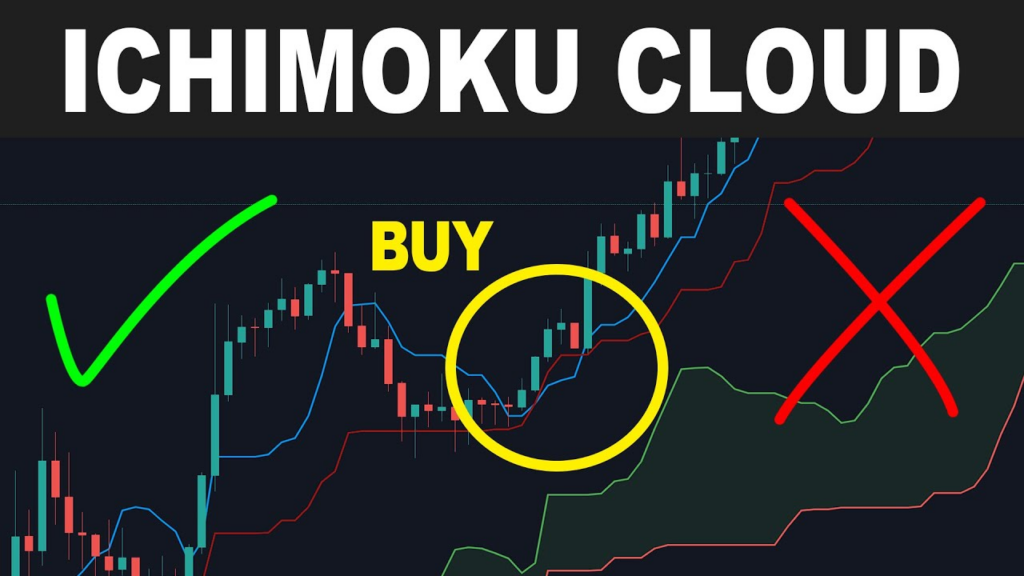
What is Ichimoku Cloud Trading?
Ichimoku Cloud Trading is a strategy that uses the Ichimoku Kinko Hyo indicator to analyze trends, momentum, and potential support and resistance levels in a single glance. This indicator is widely used in stocks, forex, and cryptocurrencies due to its ability to provide a comprehensive market view without needing additional indicators.
Developed by Japanese journalist Goichi Hosoda in the late 1960s, the Ichimoku Cloud is designed to offer high-probability trading signals based on price action relative to multiple moving averages and cloud formations.
How Ichimoku Cloud Trading Works
1. Understanding the Components of Ichimoku Cloud
The Ichimoku Cloud consists of five key components:
- Tenkan-sen (Conversion Line): The short-term moving average, calculated as the 9-period midpoint of high and low prices. It helps identify short-term momentum.
- Kijun-sen (Base Line): The medium-term moving average, calculated as the 26-period midpoint of high and low prices. It acts as a trend confirmation tool.
- Senkou Span A (Leading Span A): The average of the Tenkan-sen and Kijun-sen, plotted 26 periods ahead. It forms one edge of the cloud.
- Senkou Span B (Leading Span B): The 52-period midpoint of high and low prices, also plotted 26 periods ahead. It forms the other edge of the cloud.
- Chikou Span (Lagging Span): The current price plotted 26 periods behind. It helps confirm trend direction.
2. Identify Trend Direction
- Bullish Trend: Price is above the cloud, and the cloud is green (Senkou Span A is above Senkou Span B).
- Bearish Trend: Price is below the cloud, and the cloud is red (Senkou Span A is below Senkou Span B).
- Consolidation: Price is inside the cloud, signaling indecision or a ranging market.
3. Trading Signals Using Ichimoku Cloud
- Bullish Signal: Buy when the price crosses above the cloud, supported by a bullish Tenkan-sen and Kijun-sen crossover.
- Bearish Signal: Sell when the price drops below the cloud, supported by a bearish Tenkan-sen and Kijun-sen crossover.
- Trend Reversal Confirmation: The Chikou Span crossing above or below the price confirms the strength of a trend shift.
4. Set Stop-Loss and Take-Profit Levels
- Stop-loss: Placed below the cloud for long positions and above the cloud for short positions.
- Profit target: The next major support/resistance level or Fibonacci extension level.
- Trailing stop: Adjusted along the Kijun-sen to capture additional profits in trending markets.
Example of Ichimoku Cloud Trading
Example 1: Bullish Trade on Tesla Stock (TSLA)
A trader identifies that TSLA is trading above the Ichimoku Cloud, indicating a strong uptrend.
Trade Execution:
- Entry: The trader buys TSLA at $250 when price breaks above the cloud and Tenkan-sen crosses above Kijun-sen.
- Stop-Loss: Placed below the cloud at $230 to minimize risk.
- Profit Target: The previous swing high at $300.
- Exit: TSLA reaches $300, securing a $50 per share profit.
Example 2: Bearish Trade on Bitcoin (BTC)
A trader sees that BTC has fallen below the Ichimoku Cloud, indicating a strong downtrend.
Trade Execution:
- Entry: The trader shorts BTC at $40,000 when price breaks below the cloud.
- Stop-Loss: Placed above the cloud at $42,500.
- Profit Target: The previous support level at $35,000.
- Exit: BTC drops to $35,000, capturing a $5,000 per BTC profit.
Pros of Ichimoku Cloud Trading
- Comprehensive market view – Combines multiple indicators into one system, reducing the need for additional tools.
- Works well in trending markets – Provides strong signals in clearly defined uptrends and downtrends.
- Offers dynamic support and resistance – The cloud itself acts as a flexible price barrier.
- Effective for both short-term and long-term trades – Can be used on intraday, daily, or weekly charts.
Cons of Ichimoku Cloud Trading
- Complex for beginners – Requires understanding multiple components and their interactions.
- Less effective in choppy markets – When price stays inside the cloud, signals become unreliable.
- Lagging nature – The indicator reacts to price movements rather than predicting them.
- Requires confirmation with volume or momentum indicators – Best used alongside RSI, MACD, or Bollinger Bands.
When Should You Use Ichimoku Cloud Trading?
- If you prefer a trend-following approach with strong entry and exit rules.
- If you want a single indicator that provides multiple signals.
- If you are comfortable analyzing multiple data points on a chart.
- If you trade trending markets like stocks, forex, or major cryptocurrencies.
Final Thoughts: Is Ichimoku Cloud Trading Right for You?
Ichimoku Cloud Trading is a powerful trend-following system that provides clear entry and exit signals based on multiple price averages. While it may seem complex initially, traders who master this tool can identify strong trends, avoid false signals, and enhance their trading decisions.
For traders who want a complete trading system within one indicator, Ichimoku Cloud is an excellent choice.


