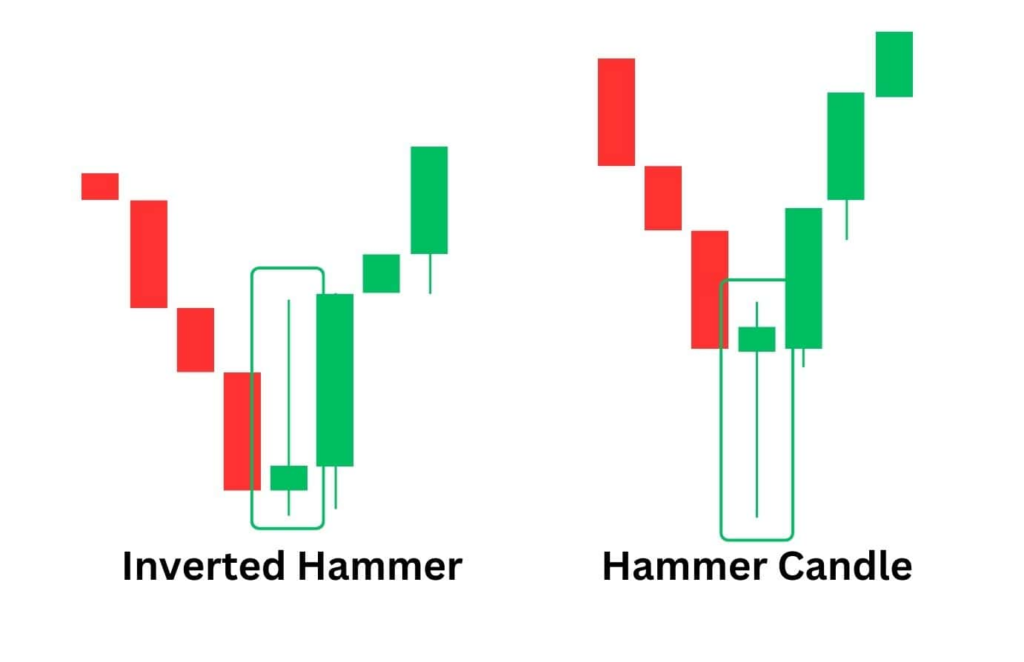
The Hammer candlestick pattern is a powerful bullish reversal signal that often appears at the bottom of a downtrend. It signifies that sellers initially pushed prices lower, but strong buying pressure reversed most or all of those losses, resulting in a close near the opening price. This pattern indicates a potential shift in momentum, signaling traders to prepare for a possible upward movement.
The Hammer is widely used in technical analysis across financial markets, including stocks, forex, and cryptocurrencies. However, for maximum effectiveness, traders should always confirm the pattern with additional indicators and market conditions before making trading decisions.
Characteristics of a Hammer Candlestick
A valid Hammer candlestick exhibits the following key characteristics:
- Small body: The body is relatively small, positioned near the top of the candlestick.
- Long lower wick: The lower wick (shadow) should be at least twice the length of the body, indicating a significant rejection of lower prices.
- Little to no upper wick: Ideally, there is no upper wick, but a very small one may be present.
- Appears after a downtrend: The Hammer pattern must form after a sustained decline for it to be considered a valid reversal signal.
The color of the Hammer candlestick (green or red) is less significant, though a green (bullish) Hammer suggests stronger buying momentum.
Psychology Behind the Hammer Pattern
The Hammer candlestick represents a shift in market sentiment. Initially, sellers dominate the session, driving prices lower. However, at some point, buyers step in aggressively, pushing prices back up and closing near the session’s opening price. This strong recovery signals that the downward momentum is weakening and that a potential reversal may be forming.
When observed at key support levels, the Hammer becomes even more significant, as it suggests that buyers are willing to defend a particular price zone, increasing the likelihood of a trend reversal.
How to Identify a Hammer Candlestick
To properly identify and validate a Hammer pattern, traders should follow these steps:
- Look for a Downtrend: The Hammer must appear after a clear downtrend to be a valid reversal signal.
- Check the Wick-to-Body Ratio: The lower wick should be at least twice the length of the body.
- Confirm with Volume: Increased volume on the Hammer candle strengthens the validity of the reversal signal.
- Observe Follow-Up Candles: A bullish confirmation candle (e.g., a strong green candlestick) after the Hammer increases confidence in the reversal.
- Use Additional Indicators: Support levels, RSI, and moving averages can help confirm the reversal.
Hammer vs. Other Similar Candlestick Patterns
| Pattern | Appearance | Meaning | Key Difference from Hammer |
|---|---|---|---|
| Hammer | Small body, long lower wick, no/short upper wick | Bullish reversal | Appears after a downtrend |
| Inverted Hammer | Small body, long upper wick, no/short lower wick | Bullish reversal | Similar to Hammer but with a long upper wick |
| Hanging Man | Small body, long lower wick, no/short upper wick | Bearish reversal | Appears after an uptrend, signaling a potential decline |
| Shooting Star | Small body, long upper wick, no/short lower wick | Bearish reversal | Opposite of the Inverted Hammer, forms after an uptrend |
Trading Strategies Using the Hammer Candlestick
1. Hammer + Confirmation Candle
- Wait for the next candle to close above the Hammer’s high.
- Enter a long position after confirmation.
- Set a stop-loss below the Hammer’s low.
2. Hammer at Key Support Levels
- Look for Hammer formations near strong support zones.
- Combine with volume analysis to validate the reversal.
- Enter trades with additional confirmation from indicators like RSI or MACD.
3. Hammer with Moving Averages
- Identify a Hammer near a 50-day or 200-day moving average.
- If price bounces off the moving average, it adds strength to the reversal signal.
4. Multi-Timeframe Analysis
- Use higher timeframes (daily/weekly) to confirm the significance of the Hammer pattern.
- If a Hammer forms on a lower timeframe but contradicts the major trend, reconsider the trade.
Limitations of the Hammer Candlestick
- False Signals: A Hammer alone is not always reliable; traders must confirm it with other indicators.
- Market Context Matters: A Hammer forming in a strong downtrend without confirmation may fail.
- News Impact: Unexpected economic events can override technical signals, invalidating a Hammer setup.
Conclusion
The Hammer candlestick pattern is a strong bullish reversal signal when identified correctly within the right market context. While it provides valuable insight into potential trend changes, traders should always confirm its validity using additional technical tools such as volume analysis, support levels, and momentum indicators.
By integrating the Hammer pattern into a comprehensive trading strategy, traders can enhance their ability to recognize high-probability reversal opportunities and improve their overall market performance.


