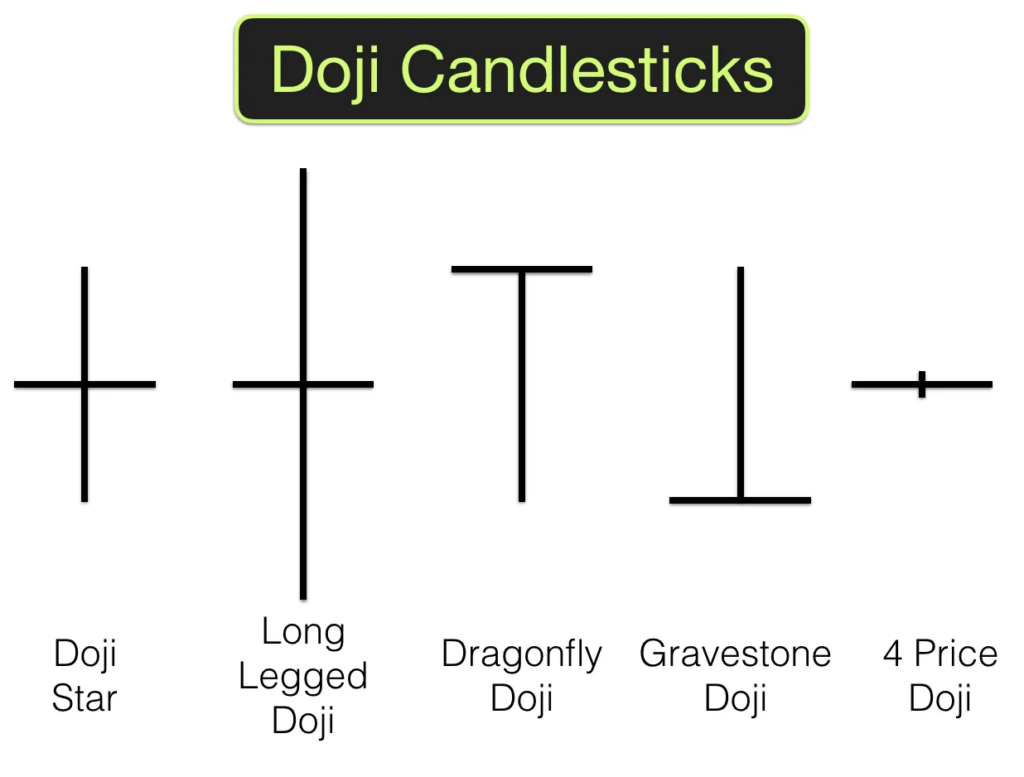
The Doji candlestick is one of the most important and widely recognized patterns in technical analysis. It signifies indecision in the market, where neither buyers nor sellers have managed to take control during a specific time period. A Doji forms when the opening and closing prices are nearly identical, resulting in a candle with a very small or non-existent body and visible wicks.
This pattern can appear in various market conditions and is often a precursor to potential reversals, trend continuations, or periods of consolidation. Understanding how to interpret different types of Doji candles can provide traders with valuable insights into price action and market sentiment.
Characteristics of a Doji Candlestick
A Doji candlestick has the following defining characteristics:
- Small or no body: The opening and closing prices are nearly identical.
- Wicks (shadows) of varying lengths: The upper and lower wicks indicate price movement within the period.
- Appears in all timeframes: Can be found in daily, hourly, and even minute charts.
- Signals indecision: Neither buyers nor sellers were able to assert dominance.
A Doji does not necessarily indicate an immediate trend reversal, but its presence often suggests a shift in momentum, making it crucial to analyze it in conjunction with other technical indicators.
Types of Doji Candlesticks and Their Meaning
1. Standard Doji – Neutral Market Sentiment
- A standard Doji has a small body with almost equal-length wicks on both sides.
- It appears when the market is uncertain or consolidating.
- When found at the top or bottom of a trend, it may indicate a potential reversal if confirmed by other signals.
2. Dragonfly Doji – Potential Bullish Reversal
- This Doji has a long lower wick and no upper wick, resembling a dragonfly.
- It forms when prices drop significantly but recover to close near the opening price.
- When found at the bottom of a downtrend, it suggests strong buying pressure and a possible bullish reversal.
3. Gravestone Doji – Potential Bearish Reversal
- This Doji has a long upper wick and no lower wick, resembling a gravestone.
- It occurs when prices rise significantly but fall back to close near the opening price.
- When found at the top of an uptrend, it signals strong selling pressure and a possible bearish reversal.
4. Long-Legged Doji – High Market Volatility
- This Doji has long upper and lower wicks, indicating significant price movement in both directions.
- It forms when the market experiences strong fluctuations but closes near the opening price.
- It suggests high volatility and can precede major breakouts or trend shifts.
5. Four-Price Doji – Extreme Market Indecision
- This rare Doji occurs when the open, high, low, and close prices are identical, creating a single horizontal line.
- It typically forms in low-liquidity conditions or during market pauses.
- It signals a complete lack of market movement and provides little predictive value.
How to Trade Using Doji Candlesticks
To effectively trade using Doji candlesticks, traders should consider the following strategies:
- Confirm with Volume
- A Doji with increased trading volume is more significant than one with low volume.
- Higher volume suggests stronger market participation and increases the likelihood of a reversal.
- Analyze Doji in Trend Context
- In an uptrend: A Doji can indicate slowing momentum and potential bearish reversal.
- In a downtrend: A Doji may signal exhaustion of selling pressure and a potential bullish reversal.
- Use Doji in Conjunction with Other Indicators
- Support and Resistance Levels: A Doji near key support or resistance adds strength to its signal.
- Moving Averages: If a Doji forms near a moving average, it could indicate a trend shift.
- Relative Strength Index (RSI): A Doji appearing in overbought or oversold regions suggests a stronger reversal potential.
- Wait for Confirmation
- Traders should avoid acting on a Doji alone and instead wait for confirmation in the next candle.
- A strong bullish or bearish candle following a Doji provides validation of the trend direction.
Doji in Different Market Conditions
- In Ranging Markets: Doji formations are common and less reliable due to frequent price indecision.
- In Trending Markets: A Doji is more significant as it can signal a slowdown or reversal in the existing trend.
- During Economic Events: Increased volatility around major news releases can produce multiple Doji candles, requiring extra caution.
Conclusion
The Doji candlestick is a vital pattern in technical analysis that signals market indecision and potential reversals. However, traders must analyze it in context and use additional indicators to confirm its signals. By understanding its variations and applying Doji-based trading strategies, traders can enhance their ability to navigate the financial markets with greater accuracy and confidence.


