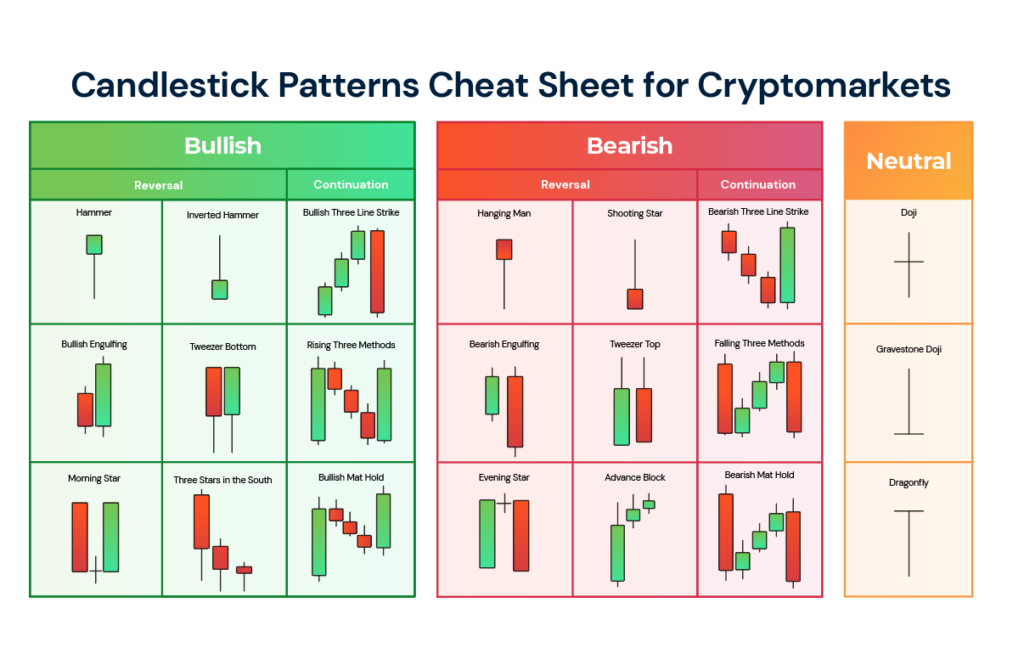
Candlestick chart analysis is one of the most powerful tools in technical analysis, providing traders with critical insights into market movements and price action. This method of analysis originated in Japan in the 18th century and has since become an essential component of modern trading strategies and Price action analysis. Unlike other charting methods, candlestick charts offer a clear and concise representation of price movements within a given period. Each candlestick encapsulates the struggle between buyers (bulls) and sellers (bears), giving traders an opportunity to gauge market sentiment and make informed trading decisions.
By studying different candlestick formations, traders can identify potential reversals, continuations, and momentum shifts, allowing them to optimize their entry and exit points. While candlestick patterns alone do not guarantee profitability, when combined with other technical indicators and market analysis, they become an invaluable asset for traders across various financial markets, including stocks, forex, and cryptocurrencies.
The Basic Elements of a Candlestick
Understanding the basic structure of a candlestick is essential for interpreting price action and market sentiment. Each candlestick provides a snapshot of market activity over a specific time period, revealing the balance of power between buyers and sellers. A single candlestick consists of three primary components, each playing a crucial role in determining market behavior:
- Body – The central, rectangular portion of the candlestick that represents the range between the opening and closing prices. The size and color of the body provide important information about market sentiment:
- A long body indicates strong price movement in a particular direction, showing dominance by either buyers or sellers.
- A short body suggests indecision or a lack of significant price movement, often leading to potential reversals or consolidations.
- Wicks (Shadows, Tails) – The thin lines extending above and below the body, representing the highest and lowest prices reached during the given time period. The wicks provide insight into price volatility and rejection levels:
- Long upper wick: Indicates that buyers initially pushed prices higher but faced strong resistance, leading to a pullback.
- Long lower wick: Suggests that sellers drove prices down, but buyers stepped in to push the price back up, often signaling support.
- Short or no wicks: When a candlestick has little to no wicks, it suggests strong momentum and a decisive move in one direction.
- Color – The color of a candlestick is a visual representation of price direction:
- Bullish candle (green or white): Occurs when the closing price is higher than the opening price, signifying buying pressure.
- Bearish candle (red or black): Forms when the closing price is lower than the opening price, indicating selling pressure.

Interpreting Candlestick Formations
By analyzing the relationship between the body, wicks, and color, traders can gain valuable insights into market psychology. Some key observations include:
- A long-bodied bullish candle with little or no wicks suggests strong upward momentum and potential continuation.
- A long-bodied bearish candle with minimal wicks indicates aggressive selling pressure and possible further decline.
- A candle with long wicks and a small body reflects market indecision, as buyers and sellers struggle for control.
The structure of individual candlesticks, when combined with historical price patterns, allows traders to anticipate potential reversals, breakouts, or trend continuations. Understanding these foundational elements is crucial before diving into more complex candlestick patterns and strategies.
Types of Candlesticks and Their Meaning
1. Doji – Indecision in the Market
- A Doji candle forms when the opening and closing prices are nearly identical, creating a small or nonexistent body.
- It signifies indecision in the market, with neither buyers nor sellers dominating.
- Common types of Doji include:
- Standard Doji – Neutral market sentiment.
- Dragonfly Doji – A potential bullish reversal when found at the bottom of a downtrend.
- Gravestone Doji – A potential bearish reversal when found at the top of an uptrend.
- Long-Legged Doji – High market volatility with no clear direction.
2. Hammer & Inverted Hammer – Bullish Reversal Signals
- Hammer: A small-bodied candle with a long lower wick, appearing at the bottom of a downtrend, indicating potential reversal.
- Inverted Hammer: A small-bodied candle with a long upper wick, suggesting bullish momentum when found in a downtrend.
3. Shooting Star & Hanging Man – Bearish Reversal Signals
- Shooting Star: A small body with a long upper wick, appearing at the top of an uptrend, signaling a potential price decline.
- Hanging Man: A small body with a long lower wick, forming at the top of an uptrend, warning of possible bearish reversal.
4. Engulfing Candles – Strong Reversal Signals
- Bullish Engulfing: A small bearish candle followed by a larger bullish candle that completely engulfs the previous one, signaling strong buying pressure.
- Bearish Engulfing: A small bullish candle followed by a larger bearish candle, indicating selling pressure and a potential downtrend.
5. Marubozu – Strong Momentum Candles
- A full-bodied candle with little to no wicks, representing strong momentum.
- Bullish Marubozu – No upper/lower wick, showing dominant buying pressure.
- Bearish Marubozu – No upper/lower wick, indicating dominant selling pressure.
6. Spinning Top – Market Uncertainty
- A small-bodied candle with long upper and lower wicks, signaling indecision in the market.
- When found within trends, it suggests potential consolidation or reversal.
7. Three Soldiers & Three Crows – Strong Trend Signals
- Three White Soldiers: Three consecutive bullish candles, signaling a strong upward trend.
- Three Black Crows: Three consecutive bearish candles, indicating strong downward momentum.
8. Tweezers – Reversal Patterns
- Tweezer Tops: Two consecutive candles with nearly identical highs, signaling a potential bearish reversal.
- Tweezer Bottoms: Two consecutive candles with nearly identical lows, indicating a possible bullish reversal.
9. Morning Star & Evening Star – Strong Reversal Signals
- Morning Star: A three-candle pattern signaling a bullish reversal, often occurring at the end of a downtrend.
- Evening Star: A three-candle pattern indicating a bearish reversal, typically forming at the peak of an uptrend.
10. Harami – Trend Weakening Signal
- Bullish Harami: A small bullish candle contained within the body of the previous bearish candle, signaling potential reversal.
- Bearish Harami: A small bearish candle forming inside the body of the prior bullish candle, suggesting a possible trend change.
How to Use Candlestick Patterns in Trading
To effectively integrate candlestick patterns into a trading strategy, traders must go beyond simple recognition and apply them in a structured approach. Here are key methods to maximize the potential of candlestick analysis:
- Combine Candlestick Patterns with Support and Resistance Levels
- Confirm with Volume Analysis
- Analyze Candlestick Formations on Higher Timeframes
- Use Technical Indicators for Additional Confirmation
- Consider Market Context and Trends


