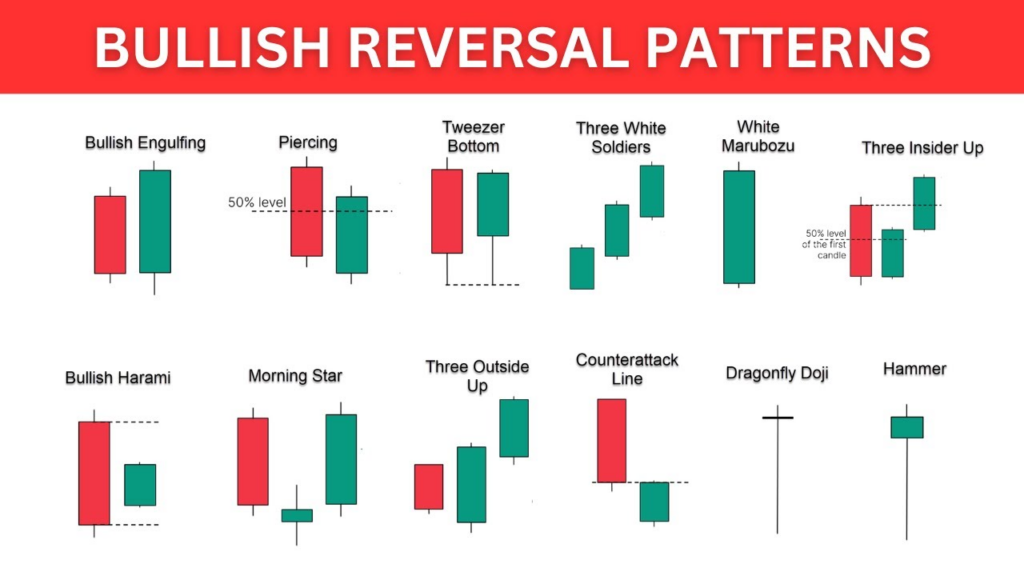
Bullish reversal patterns are candlestick formations that signal a potential shift from a downtrend to an uptrend. These patterns help traders spot buying opportunities by indicating that selling pressure is weakening and buyers are stepping in with strength.
This guide covers six powerful bullish reversal patterns that traders use to identify market bottoms and trend reversals:
- Hammer – Small body with a long lower wick, signaling a potential reversal after a downtrend.
- Bullish Engulfing – A larger green candle engulfs the previous red candle, indicating strong buying momentum.
- Morning Star – A three-candle pattern showing a transition from bearish to bullish sentiment.
- Piercing Line – A bullish candle that opens below the previous red candle but closes above its midpoint.
- Tweezer Bottom – Two candles with equal lows, suggesting strong support.
- Three White Soldiers – Three consecutive strong green candles signaling a bullish reversal.
By the end of this article, you’ll understand how to identify, confirm, and trade these bullish reversal patterns effectively.
1. Hammer: A Classic Reversal Signal
What is a Hammer?
A Hammer is a single-candle bullish reversal pattern that appears at the bottom of a downtrend. It has:
✔ A small real body near the top of the candle.
✔ A long lower wick (at least twice the size of the body), showing that buyers pushed the price higher after sellers tried to drive it down.
✔ Little or no upper wick, indicating a strong recovery.
Why Does It Form?
It signals that sellers pushed prices lower, but buyers stepped in aggressively, reversing most of the losses by the close.
How to Trade It?
- Confirmation: The next candle should be bullish.
- Entry: Enter a long position above the Hammer’s high.
- Stop-Loss: Below the Hammer’s low.
- Target: Next resistance level.
2. Bullish Engulfing: Strong Buying Momentum
What is a Bullish Engulfing Pattern?
A Bullish Engulfing is a two-candle bullish reversal pattern that appears at the end of a downtrend. It consists of:
✔ A small red candle (Day 1), representing weak selling.
✔ A large green candle (Day 2) that completely engulfs the previous red candle, indicating a strong shift in momentum.
Why Does It Form?
It shows that buying pressure has overwhelmed selling pressure, signaling a potential uptrend.
How to Trade It?
- Confirmation: Higher volume on the second candle strengthens the signal.
- Entry: Enter a long position at the close of the second candle.
- Stop-Loss: Below the second candle’s low.
- Target: Next resistance level.
3. Morning Star: A Three-Candle Bullish Reversal
What is a Morning Star?
The Morning Star is a three-candle bullish reversal pattern that appears at the bottom of a downtrend. It consists of:
✔ A large bearish candle (Day 1) continuing the downtrend.
✔ A small-bodied candle (Day 2), which could be a doji or neutral candle, indicating market hesitation.
✔ A strong bullish candle (Day 3) that closes above the midpoint of the first candle.
Why Does It Form?
The second candle shows market indecision, and the third candle confirms that buyers have taken control.
How to Trade It?
- Confirmation: The third candle should be a strong bullish close.
- Entry: Enter a long trade at the close of the third candle.
- Stop-Loss: Below the low of the second candle.
- Target: Next resistance level.
4. Piercing Line: A Strong Reversal Signal
What is a Piercing Line?
A Piercing Line is a two-candle bullish reversal pattern that appears at the end of a downtrend. It consists of:
✔ A large red candle (Day 1), showing continued selling pressure.
✔ A large green candle (Day 2) that opens below the previous candle’s close but closes above its midpoint.
Why Does It Form?
It indicates that sellers started strong, but buyers regained control, forcing a strong recovery.
How to Trade It?
- Confirmation: Volume increase on the second candle adds strength.
- Entry: Enter a long trade above the second candle’s high.
- Stop-Loss: Below the second candle’s low.
- Target: Next resistance level.
5. Tweezer Bottom: A Double Rejection of Lower Prices
What is a Tweezer Bottom?
The Tweezer Bottom is a two-candle bullish reversal pattern that signals strong support at a specific price level. It consists of:
✔ Two consecutive candles with equal or nearly equal lows.
✔ The first candle is bearish, and the second is bullish.
Why Does It Form?
It indicates that sellers tried to push the price lower twice but failed, signaling that buyers are taking over.
How to Trade It?
- Confirmation: Look for additional bullish signals like RSI divergence or increased volume.
- Entry: Enter a long position after the second candle confirms the reversal.
- Stop-Loss: Below the tweezer low.
- Target: Next resistance level.
6. Three White Soldiers: A Strong Bullish Reversal
What is a Three White Soldiers Pattern?
The Three White Soldiers is a three-candle bullish reversal pattern that appears after a downtrend. It consists of:
✔ Three consecutive strong green candles.
✔ Each candle opens within the previous candle’s body and closes near its high.
Why Does It Form?
It shows that buyers are in full control, with sustained momentum over three sessions, confirming a strong uptrend.
How to Trade It?
- Confirmation: The pattern is stronger when volume increases.
- Entry: Enter a long trade at the close of the third candle.
- Stop-Loss: Below the first candle’s low.
- Target: Next resistance level.
Final Thoughts: Mastering Bullish Reversal Patterns
Understanding bullish reversal patterns helps traders spot potential market bottoms and early entry points into uptrends. However, for maximum accuracy, traders should:
✔ Use volume confirmation to validate the pattern.
✔ Combine with technical indicators (e.g., RSI, MACD) for extra confirmation.
✔ Identify key support levels before entering trades.
By mastering these six bullish reversal patterns, traders can effectively capitalize on trend reversals and improve their trading success.


