In the world of trading, patterns and indicators help traders make informed decisions. Among these, the Bullish Engulfing candlestick pattern is one of the most powerful and reliable signals for identifying potential market reversals. It is widely used by traders to spot a shift from bearish to bullish sentiment and to capitalize on trend changes.
This guide will cover:
- What is a Bullish Engulfing pattern?
- How to identify it on a chart?
- Why does it form?
- How to trade it effectively?
- Common mistakes and tips for better accuracy.
By the end of this article, you will have a deep understanding of how to use the Bullish Engulfing pattern in your trading strategy.
What is a Bullish Engulfing Pattern?
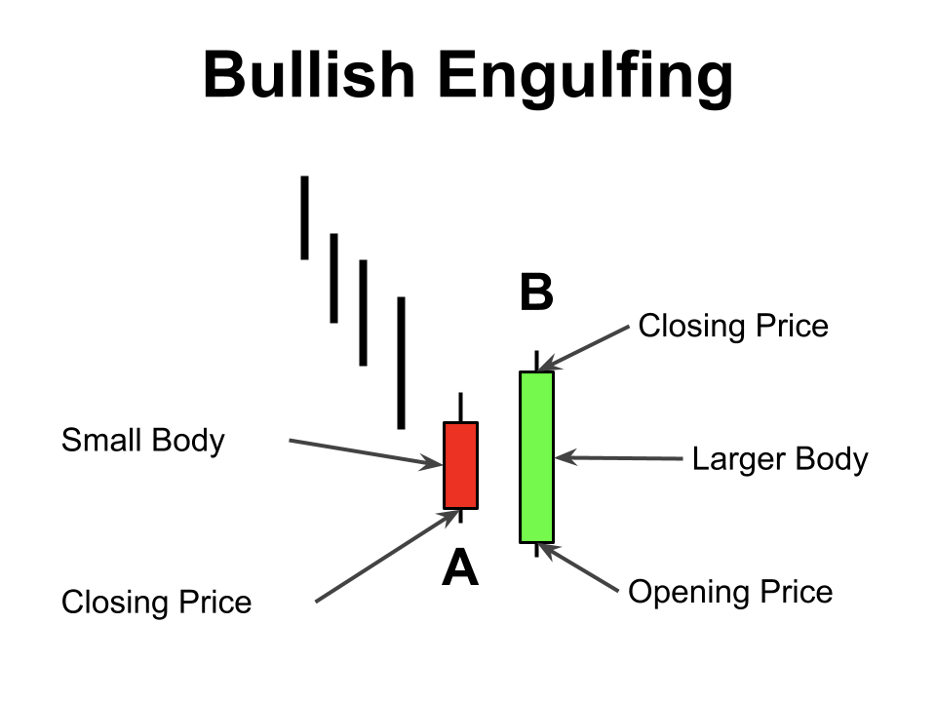
A Bullish Engulfing pattern is a two-candle reversal formation that appears at the end of a downtrend, signaling a potential shift in market sentiment from bearish to bullish. It consists of:
- A Small Bearish Candle (Day 1) – This represents the continuation of the existing downtrend, where sellers remain in control, pushing the price lower.
- A Large Bullish Candle (Day 2) – The next trading session opens at or below the previous day’s close but experiences strong buying pressure, driving the price significantly higher and completely engulfing the first candle’s body.
The significance of this pattern lies in its ability to reflect a sudden and decisive shift in market psychology. On the first day, sellers appear dominant, but the strong bullish candle on the second day indicates that buying interest has overwhelmed selling pressure, leading to a potential trend reversal.
For the Bullish Engulfing pattern to be valid, the second candle must fully cover the body of the first candle (excluding wicks). The greater the size of the engulfing candle, the stronger the bullish momentum. This pattern is particularly effective when it appears near key support levels, moving averages, or after prolonged downtrends, as it suggests an exhaustion of selling pressure and the emergence of fresh buying interest.
How to Identify a Bullish Engulfing Pattern?
To spot a Bullish Engulfing pattern on a chart, look for the following characteristics:
Essential Conditions:
✔ Occurs in a Downtrend – The market must be in a clear bearish phase before the pattern appears.
✔ First Candle is Bearish – The first candle is red, reflecting continued selling pressure.
✔ Second Candle is Bullish and Larger – The second candle completely engulfs the first one, signaling a momentum shift.
✔ Significant Increase in Volume – A noticeable increase in volume on the second candle strengthens the pattern’s reliability.
Invalid Conditions:
✖ If the engulfing candle appears in an uptrend, it is NOT a bullish engulfing—it’s just a continuation pattern.
✖ If the second candle does not fully engulf the previous red candle, the pattern is incomplete.
✖ If there is no significant volume increase, the move may lack strength.
Why Does a Bullish Engulfing Pattern Form?
The psychology behind the pattern is straightforward yet powerful:
- Bears Start Strong: The market is in a downtrend, and traders continue selling, creating a small red candle.
- Bulls Take Over: The next session opens lower or at a similar level, but strong buying pressure pushes the price significantly higher.
- Momentum Shifts: Since the bullish candle completely engulfs the previous bearish one, it indicates that buyers have overwhelmed sellers.
This shift in power often leads to a trend reversal or at least a strong retracement in the opposite direction.
How to Trade the Bullish Engulfing Pattern?
Trading the Bullish Engulfing pattern successfully requires a strategic approach. Here’s a step-by-step method:
Step 1: Identify the Pattern in a Downtrend
Ensure the market has been moving downward before the pattern appears.
Step 2: Confirm with Additional Indicators
For higher accuracy, combine it with:
✔ Support Levels – If the pattern appears near a strong support zone, it adds credibility.
✔ Moving Averages – A bullish engulfing near the 50-day or 200-day moving average is a stronger signal.
✔ RSI (Relative Strength Index) – An RSI below 30 (oversold condition) increases the chances of a reversal.
✔ MACD (Moving Average Convergence Divergence) – A bullish crossover after the engulfing pattern strengthens the buy signal.
Step 3: Place Your Trade
- Entry Point: Buy at the close of the engulfing candle or on a slight pullback.
- Stop-Loss: Place below the low of the engulfing candle to limit risk.
- Take Profit: Target the next resistance level or use a risk-reward ratio of 1:2 or 1:3.
Step 4: Monitor Trade and Adjust
- If volume remains high, the trend is more likely to continue.
- If price struggles at resistance, consider securing profits early.
Real-World Example of a Bullish Engulfing Pattern
Consider a scenario where Apple Inc. (AAPL) stock has been in a steady downtrend for several weeks, declining from $160 to $140. Investors remain bearish, anticipating further declines. However, on a particular day, Apple’s stock forms a small red candle, closing at $140 after opening at $143. This suggests that sellers are still in control.
The following day, the stock opens lower at $138, reinforcing the negative sentiment. However, as the session progresses, buyers step in aggressively, driving the price upward. By the end of the day, Apple’s stock closes at $145, with a large green candle that completely engulfs the previous red candle.
This price action signals a potential trend reversal, as it demonstrates that buyers have regained control. Traders recognizing this pattern may enter a long position at $145, setting a stop-loss below the low of the engulfing candle at $138. If the bullish momentum continues, the stock could rally to the next resistance level at $155 or higher, providing a strong risk-reward opportunity.
Such real-world occurrences highlight why the Bullish Engulfing pattern is widely used among traders and investors. When combined with volume confirmation, technical indicators, and market context, it becomes a powerful tool for identifying potential market reversals.
Common Mistakes When Trading Bullish Engulfing
❌ Ignoring Volume – A pattern without volume confirmation is weak.
❌ Trading in a Range – Engulfing patterns work best at the end of a clear trend, not in choppy markets.
❌ Placing a Tight Stop-Loss – Market fluctuations can trigger stops too early.
❌ Forgetting Confirmation – Always use support levels or indicators for extra validation.
Final Thoughts: Is Bullish Engulfing Reliable?
The Bullish Engulfing is one of the most powerful and widely-used reversal patterns. However, for maximum accuracy, traders should:
- Use it in combination with other indicators.
- Trade it near strong support zones.
- Always wait for confirmation before entering.
When applied correctly, this pattern can be an excellent tool for catching trend reversals and making profitable trades.