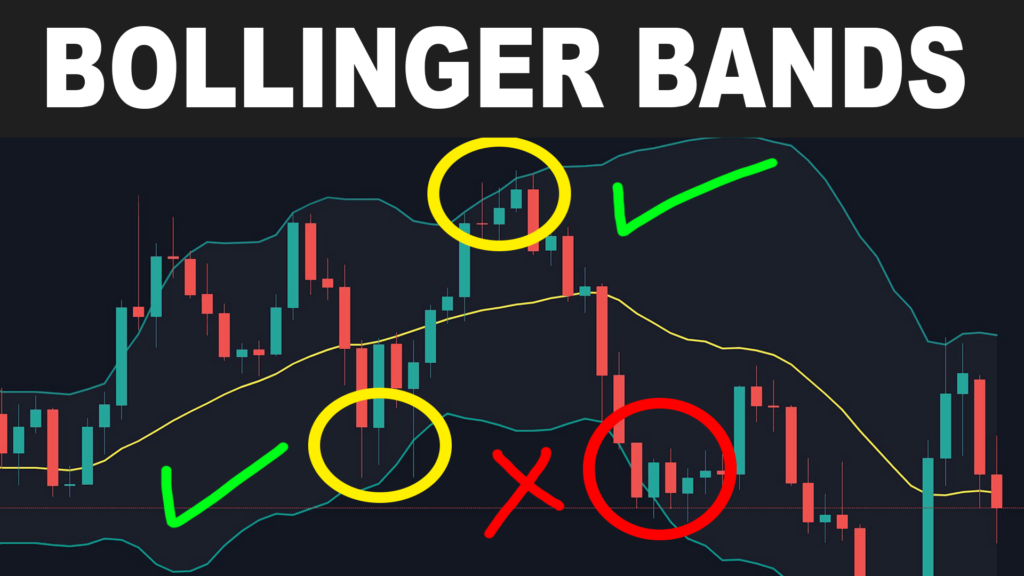
What is Bollinger Bands Trading?
Bollinger Bands trading is a strategy that uses Bollinger Bands, a volatility-based technical indicator, to identify potential overbought and oversold conditions, as well as breakout opportunities. Bollinger Bands help traders determine when an asset is trading at extreme levels relative to its recent price action, making it a valuable tool for both trend-following and reversal strategies.
Developed by John Bollinger in the 1980s, Bollinger Bands consist of three lines:
- Middle Band: A simple moving average (SMA), typically set to 20 periods.
- Upper Band: The SMA plus two standard deviations, representing overbought levels.
- Lower Band: The SMA minus two standard deviations, representing oversold levels.
When price reaches the upper or lower band, it suggests that the asset may be overextended and due for a reversal or a continuation breakout.
How Bollinger Bands Trading Works
1. Identify Market Conditions Using Bollinger Bands
- Low Volatility (Squeeze Phase): When the bands contract, it signals that volatility is low, often preceding a large breakout.
- High Volatility (Expansion Phase): When the bands widen, it indicates increased volatility, often following a price surge or collapse.
- Overbought Condition: Price touching the upper band suggests that the asset may be overbought, signaling a potential pullback.
- Oversold Condition: Price touching the lower band suggests that the asset may be oversold, signaling a potential bounce.
2. Trading Strategies Using Bollinger Bands
Bollinger Band Mean Reversion Strategy
- Buy when price touches the lower band and shows signs of reversal.
- Sell when price touches the upper band and shows weakness.
- Confirmation signals: RSI below 30 (oversold) for buys, RSI above 70 (overbought) for sells.
Bollinger Band Breakout Strategy
- Enter long when price closes above the upper band, indicating strong bullish momentum.
- Enter short when price closes below the lower band, signaling bearish momentum.
- Confirmation signals: Increased volume and a strong breakout candle.
3. Setting Stop-Loss and Take-Profit Levels
- Stop-loss: Placed slightly beyond the bands to protect against false signals.
- Take-profit: Can be set at the opposite band or a key resistance/support level.
- Trailing stops: Can be used to ride strong trends.
Example of Bollinger Bands Trading
Example 1: Mean Reversion Trade on Apple Stock (AAPL)
A trader observes that AAPL stock touches the lower Bollinger Band at $140 while RSI shows an oversold condition.
Trade Execution:
- Entry: The trader buys AAPL at $142 as price begins to bounce.
- Stop-Loss: Placed at $138 to limit downside risk.
- Profit Target: The middle Bollinger Band at $150.
- Exit: AAPL reaches $150, securing an $8 per share profit.
Example 2: Breakout Trade on Bitcoin (BTC)
A trader notices that Bitcoin is trading in a tight range, with Bollinger Bands squeezing. A breakout occurs above the upper band.
Trade Execution:
- Entry: The trader buys BTC at $42,000 after a strong breakout above the upper band.
- Stop-Loss: Placed at $40,500 in case of a false breakout.
- Profit Target: Previous resistance at $48,000.
- Exit: BTC reaches $48,000, capturing a $6,000 per BTC profit.
Pros of Bollinger Bands Trading
- Versatile strategy – Can be used for mean reversion, trend trading, and breakouts.
- Effective in all market conditions – Works in ranging, trending, and volatile markets.
- Clear entry and exit points – The bands provide natural support and resistance levels.
- Visually intuitive – Easy to spot volatility shifts and potential trade setups.
Cons of Bollinger Bands Trading
- False signals can occur – Price may break the bands briefly before reversing.
- Not effective in strong trends without confirmation – Requires additional indicators for validation.
- Lagging nature – Based on past price action, meaning sudden fundamental shifts can override signals.
- Requires risk management – Poorly placed stop-losses can lead to frequent losses.
When Should You Use Bollinger Bands Trading?
- If you prefer a technical approach based on volatility and price action.
- If you like structured trading setups with defined risk-reward ratios.
- If you trade forex, stocks, or crypto markets with high liquidity.
- If you are comfortable using confirmation indicators like RSI, MACD, and volume analysis.
Final Thoughts: Is Bollinger Bands Trading Right for You?
Bollinger Bands are a powerful tool for analyzing volatility and market conditions, making them valuable for both beginner and experienced traders. While they work well for range-bound trading and breakouts, traders must combine them with additional indicators to filter out false signals.
For traders who want a dynamic way to analyze price movements and optimize trade entries, Bollinger Bands offer a structured and effective strategy.


