What is Bollinger Bands Trading?
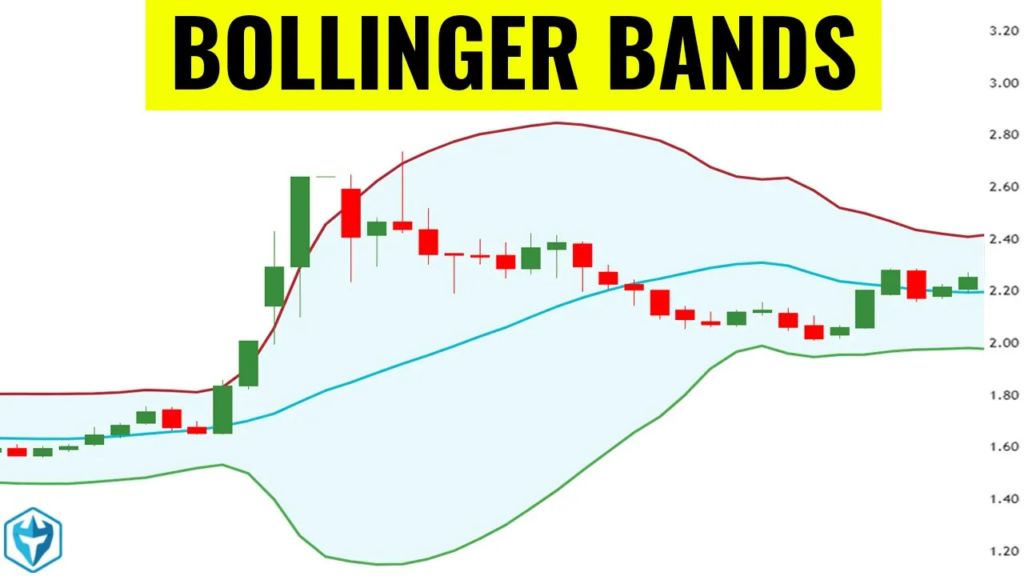
Bollinger Bands trading is a strategy that leverages Bollinger Bands, a volatility-based indicator, to identify key trading opportunities. These bands help traders determine whether an asset is overbought, oversold, or poised for a breakout based on recent price action.
Developed by John Bollinger in the 1980s, Bollinger Bands consist of three components:
- Middle Band: A 20-period simple moving average (SMA), representing the average price over time.
- Upper Band: The SMA plus two standard deviations, marking the overbought threshold.
- Lower Band: The SMA minus two standard deviations, marking the oversold threshold.
Price tends to stay within these bands, making them a powerful tool for trend analysis, breakout strategies, and mean reversion trades.
How Bollinger Bands Trading Works
1. Recognizing Market Conditions with Bollinger Bands
- Bollinger Band Squeeze (Low Volatility): A tightening of the bands signals a period of low volatility, often preceding a breakout.
- Bollinger Band Expansion (High Volatility): Widening bands indicate increasing volatility and a continuation of momentum.
- Overbought Condition: When price reaches the upper band, it suggests a potential reversal or consolidation.
- Oversold Condition: When price reaches the lower band, it signals a potential bounce or trend continuation.
2. Effective Bollinger Bands Trading Strategies
Mean Reversion Strategy
- Buy when price touches the lower band and shows bullish reversal signals.
- Sell when price reaches the upper band and loses upward momentum.
- Confirm trades using RSI: RSI below 30 (oversold) supports buying, RSI above 70 (overbought) supports selling.
Breakout Strategy
- Enter long when price closes above the upper band, indicating a potential uptrend.
- Enter short when price closes below the lower band, signaling a possible downtrend.
- Confirm breakouts using volume spikes and strong candlestick patterns.
3. Setting Stop-Loss and Take-Profit Levels
- Stop-loss: Placed slightly beyond the bands to protect against false breakouts.
- Take-profit: Target can be the opposite band or a nearby resistance/support level.
- Trailing stop: Useful in trending markets to lock in profits.
Example of Bollinger Bands Trading
Example 1: Mean Reversion Trade on Apple (AAPL)
A trader observes that AAPL stock touches the lower Bollinger Band at $140 while RSI shows an oversold condition.
Trade Execution:
- Entry: Buy at $142 as price begins to rebound.
- Stop-Loss: Set at $138 to limit risk.
- Profit Target: The middle Bollinger Band at $150.
- Exit: AAPL reaches $150, yielding an $8 per share profit.
Example 2: Breakout Trade on Bitcoin (BTC)
A trader identifies BTC consolidating within a tight range before breaking above the upper Bollinger Band.
Trade Execution:
- Entry: Buy BTC at $42,000 after confirmation of a breakout.
- Stop-Loss: Set at $40,500 to prevent excessive loss.
- Profit Target: The previous resistance at $48,000.
- Exit: BTC reaches $48,000, securing a $6,000 per BTC profit.
Pros of Bollinger Bands Trading
- Versatile for multiple strategies – Can be used for mean reversion, breakouts, and trend following.
- Works in all market conditions – Effective in both trending and ranging markets.
- Clear entry and exit points – The bands naturally define support and resistance.
- Great for visualizing volatility – Helps traders spot shifts in market conditions instantly.
Cons of Bollinger Bands Trading
- False signals are common – Price can briefly break the bands before reversing.
- Lagging indicator – Bollinger Bands rely on past price data, making them reactive rather than predictive.
- Needs confirmation tools – Best used alongside RSI, MACD, or volume analysis.
- Not ideal for strong trends without adjustments – In sustained trends, price may hug one band, leading to missed opportunities.
When Should You Use Bollinger Bands Trading?
- If you prefer a strategy based on volatility and price extremes.
- If you like structured setups with defined risk-reward ratios.
- If you trade forex, stocks, or crypto markets with high liquidity.
- If you can effectively use additional confirmation indicators.
Final Thoughts: Is Bollinger Bands Trading Right for You?
Bollinger Bands are an essential tool for traders looking to capitalize on volatility and price fluctuations. Whether used for mean reversion trades, breakout setups, or trend confirmation, this strategy provides clear visual cues for informed decision-making.
However, Bollinger Bands should be paired with other indicators for better accuracy, especially in strong trending markets. For traders looking for a structured, adaptable strategy, Bollinger Bands remain a reliable and effective choice.


