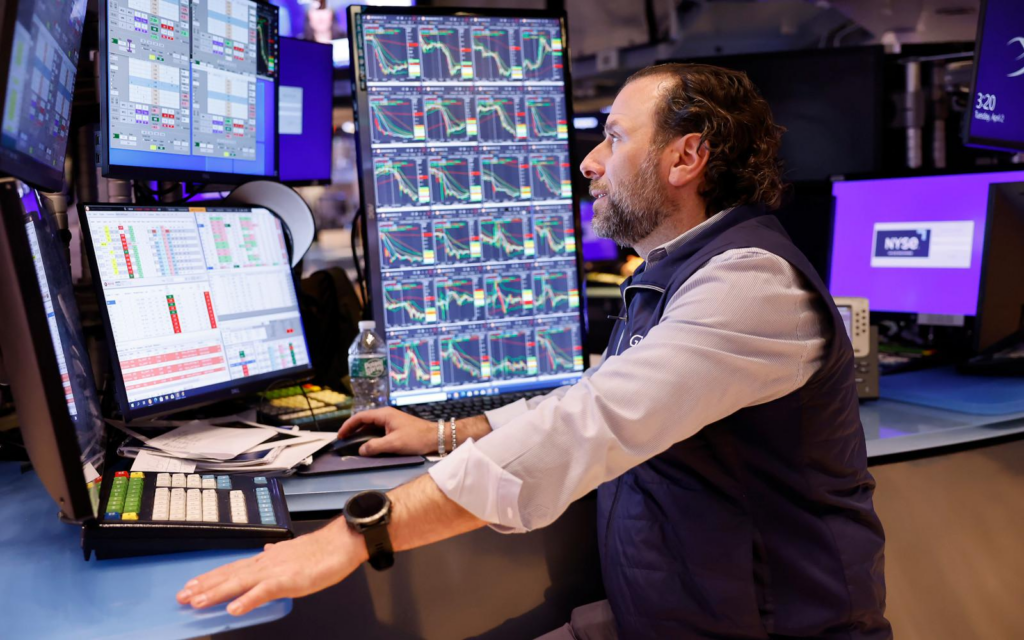
The cryptocurrency market stands apart from traditional financial markets due to its extreme volatility, unpredictability, and rapid development pace. New digital assets emerge almost daily, technological innovations occur at breakneck speed, and breaking news can dramatically shift investor sentiment within just a few hours. In such a dynamic trading environment, understanding and analyzing price behavior is not just helpful — it is absolutely essential for achieving consistent success in crypto trading.
Technical analysis (TA) plays a crucial role in this landscape. It helps traders systematically organize price movement data, recognize recurring market patterns, and build informed trading forecasts. Unlike fundamental analysis, which focuses on evaluating the intrinsic value of an asset by studying economic and financial factors, technical analysis concentrates exclusively on market behavior — including price action, trading volumes, market volatility, and other statistical metrics.
Among the most powerful tools in technical analysis are indicators. These mathematical models simplify complex market data, uncover hidden trading signals, and support traders in making more rational and strategic decisions.
What Is Technical Analysis?
Technical analysis is a method of evaluating and forecasting the future price movements of assets based primarily on the study of past market data — including prices, trading volumes, and levels of supply and demand. Unlike fundamental analysis, which seeks to determine an asset’s intrinsic value by examining underlying economic and financial factors, technical analysis assumes that all available information is already reflected in the price.
The three foundational principles of technical analysis are:
- Price Discounts Everything
According to this principle, all known and unknown information — whether it pertains to a company’s financial health, market sentiment, geopolitical events, or macroeconomic data — is already embedded in the current price. Thus, the price itself becomes the ultimate object of study. - Prices Move in Trends
Markets do not move randomly. Instead, prices typically move in identifiable patterns known as trends — either upward, downward, or sideways. Recognizing these trends early can offer traders a significant strategic advantage, allowing them to ride movements rather than react to them too late. - History Repeats Itself
Human psychology tends to produce predictable patterns of behavior in financial markets. Therefore, price movements tend to form recognizable patterns over time. Technical analysts study these historical patterns (such as head and shoulders, double tops, and flags) to anticipate future price actions.
Technical analysis operates on the belief that by analyzing past patterns and behaviors, one can make educated assumptions about future movements. While it does not offer certainties, it provides a probabilistic framework that helps traders manage risk and identify opportunities.
Why Is Technical Analysis Especially Important for Cryptocurrencies?
The application of technical analysis is particularly critical in the cryptocurrency market due to its unique characteristics, which set it apart from traditional financial markets:
- High Volatility
Cryptocurrencies are notorious for their extreme price fluctuations. A single news event, regulatory update, or social media trend can cause double-digit percentage movements within hours. Technical analysis helps traders navigate this volatility by identifying entry and exit points, minimizing emotional decision-making. - Lack of Fundamental Basis
Unlike traditional assets such as stocks or bonds, many cryptocurrency projects lack tangible business models, cash flow statements, or real-world use cases. The absence of traditional valuation metrics renders fundamental analysis less effective. Consequently, technical analysis becomes the primary tool for assessing market dynamics. - Dominance of Emotions
Fear, uncertainty, doubt (FUD) and fear of missing out (FOMO) drive large portions of cryptocurrency market activity. These emotional reactions often create exaggerated price movements, forming discernible patterns that technical analysis aims to capture and interpret objectively. - 24/7 Trading Environment
Unlike traditional stock exchanges that operate during set business hours, cryptocurrency markets are open 24 hours a day, 7 days a week, including holidays. This constant activity increases the need for tools that can monitor and interpret market behavior continuously — a role that technical indicators fulfill effectively.
Given these features, technical analysis is not merely useful for cryptocurrency traders — it is essential. It provides a structured, disciplined approach to navigating an otherwise chaotic and unpredictable market landscape.
What Are Indicators in Technical Analysis?
In the realm of technical analysis, indicators are mathematical formulas and algorithms designed to process historical price and volume data. Their primary purpose is to transform raw market information into easily interpretable visual signals, aiding traders in identifying patterns, trends, and potential reversals with greater clarity.
Indicators do not predict the future. Instead, they interpret existing market dynamics to increase the probability of making informed trading decisions. By filtering out random price fluctuations and organizing data into coherent structures, indicators become indispensable tools for any trader seeking to operate with a disciplined, data-driven approach.
How Indicators Work: How They Help Traders
Indicators function by analyzing a range of market variables, including:
- Opening prices
- Closing prices
- Intraday highs and lows
- Trading volumes
By applying mathematical calculations to these inputs, indicators generate graphical representations or values that highlight otherwise hidden aspects of market behavior.
Key functions of indicators include:
- Smoothing Out Market Noise:
Indicators help traders look past minor, random price movements, allowing them to focus on underlying trends and meaningful signals. - Identifying Trends:
They assist in detecting the beginning, continuation, or end of market trends, providing traders with crucial information about the current phase of market movement. - Signaling Potential Trend Changes:
Many indicators are specifically designed to warn of possible reversals in the market, offering early alerts to adjust positions accordingly.
Used properly, indicators provide not certainty, but a statistical edge — helping traders operate with higher probability setups rather than relying on intuition alone.
Main Types of Indicators
Technical indicators are generally categorized into three main groups, based on their primary analytical purpose:
1. Trend Indicators
Purpose:
Identify the prevailing direction of the market — whether bullish, bearish, or ranging sideways.
- Simple Moving Average (SMA):
Averages a set number of past closing prices to smooth out short-term fluctuations. - Exponential Moving Average (EMA):
Gives greater weight to recent prices, making it more sensitive to recent market activity. - Average Directional Index (ADX):
Measures the strength (but not the direction) of a prevailing trend.
Application:
Trend indicators help traders align their positions with the broader market direction, increasing the chances of success by “trading with the trend.”
2. Oscillators
Purpose:
Identify potential overbought or oversold conditions in the market, which may precede trend reversals.
Examples:
- Relative Strength Index (RSI):
Evaluates the magnitude of recent price changes to determine if an asset is overbought or oversold. - Stochastic Oscillator:
Compares a closing price to a range of prices over a specific period, highlighting potential reversal points. - Moving Average Convergence Divergence (MACD):
Measures the relationship between two EMAs and provides signals of momentum changes.
Application:
Oscillators are particularly useful during sideways markets where trend-following indicators may provide little actionable information.
3. Volume Indicators
Purpose:
Analyze the volume behind price movements to assess the strength and validity of ongoing trends or reversals.
Examples:
- On-Balance Volume (OBV):
Tracks cumulative buying and selling pressure based on trading volume and price movements. - Chaikin Money Flow (CMF):
Measures the flow of money into or out of an asset over a specified period by analyzing both price and volume.
Application:
Volume indicators confirm whether price movements are supported by a corresponding increase in trading activity, thus strengthening the reliability of signals derived from price action.
Indicators transform raw market data into actionable insights. By combining different types of indicators — trend, momentum, and volume — traders can build more robust strategies and improve their decision-making processes.
Examples of Using Indicators in Cryptocurrency Trading
Technical indicators are powerful tools that, when applied correctly, can greatly enhance a trader’s ability to interpret market behavior. Here are practical examples of how some of the most popular indicators are used in the cryptocurrency markets:
Moving Averages
BTC and the 200-Day Simple Moving Average (SMA):
The 200-day SMA is a widely respected long-term trend indicator. When Bitcoin’s price crosses below the 200-day SMA, it often signals the beginning of a bearish phase, prompting traders to adopt a more cautious or short-biased approach.
ETH and the 50-Day Exponential Moving Average (EMA):
The 50-day EMA is sensitive to recent price changes and is commonly used to identify short-term trends. When Ethereum’s price holds above the 50-day EMA, it typically supports the continuation of short-term upward movements, providing bullish confirmation.
Relative Strength Index (RSI)
The RSI measures the speed and change of price movements to identify overbought or oversold conditions.
- RSI above 70 generally indicates an overbought condition, suggesting the potential for a corrective pullback.
- RSI below 30 signals an oversold condition, implying a potential price rebound.
Example:
In the spring of 2021, Bitcoin’s RSI surged above 80, indicating extreme overbought conditions. Shortly afterward, the market experienced a sharp correction, validating the RSI’s warning.
Moving Average Convergence Divergence (MACD)
The MACD is a momentum indicator that reveals changes in the strength, direction, momentum, and duration of a trend.
- A MACD line crossing above the signal line typically signals the beginning of bullish momentum.
- Conversely, a MACD line crossing below the signal line can signal emerging bearish momentum.
In autumn 2020, Ethereum’s MACD line crossed above its signal line on the weekly chart, accurately signaling the start of a major bull run that saw ETH prices multiply over the subsequent months.
On-Balance Volume (OBV)
OBV uses cumulative volume flow to predict price changes. A rising OBV line indicates that volume is increasing on up days, suggesting accumulation and potential further price increases.
At the end of 2020, Bitcoin’s OBV showed significant upward movement, confirming strong accumulation by market participants and supporting the subsequent price rally that propelled BTC to new all-time highs.
Common Mistakes When Using Indicators
Even the most sophisticated indicators can lead to poor trading decisions if misused. Here are the most common pitfalls:
1. Blind Faith in Indicators
Indicators should not be viewed as infallible predictors of future market movements. They are tools designed to interpret past data. Successful traders combine indicator signals with broader market context, price action, and macroeconomic factors.
2. Overloading Charts with Indicators
Using too many indicators often results in conflicting signals, leading to analysis paralysis — the inability to make decisions due to excessive data. A focused strategy using a few well-understood indicators is usually more effective.
3. Ignoring Market Context
Different market phases require different analytical tools. Trend-following indicators are effective during trending markets, while oscillators are better suited for ranging or sideways conditions. Failure to adapt to the current market environment diminishes the effectiveness of any indicator.
4. Neglecting Risk Management
Even the most reliable signals can fail. Therefore, strict risk management practices — including setting stop-loss levels and appropriate position sizing — are essential components of any successful trading strategy.
Conclusions and Practical Recommendations
Technical indicators are indispensable elements of cryptocurrency trading strategies. However, they must be employed thoughtfully and as part of a comprehensive analytical framework.
Key Recommendations:
- Combine multiple complementary indicators to increase the reliability of your signals.
- Always interpret indicator readings within the broader market context.
- Build a structured trading system that includes clear rules for risk management and position sizing.
- Never rely solely on indicators; incorporate market sentiment, news events, and macroeconomic factors into your analysis.
When used competently, technical analysis and indicators can significantly increase the probability of success, helping traders navigate the dynamic and often unpredictable cryptocurrency markets with greater confidence.
About REVOLD BLOG
REVOLD BLOG — a trusted platform offering expert-driven insights into the dynamic worlds of finance, software development, and breakthrough technologies.
Whether you are a seasoned investor, an aspiring developer, or simply passionate about innovation, our content is designed to inspire, educate, and keep you ahead of the curve.


