What are Candlestick Patterns?
Candlestick patterns are visual representations of price action that help traders understand market sentiment and predict potential reversals or continuations. Each candlestick reflects price movements within a specific timeframe, showing the open, high, low, and close prices.
Candlestick charts are widely used in stocks, forex, and cryptocurrencies due to their effectiveness in identifying trend strength, reversals, and breakout opportunities.
How Candlestick Patterns Work
1. Understanding the Components of a Candlestick
Each candlestick consists of:
- Body: The range between the opening and closing prices.
- Wick (Shadow): The highest and lowest prices within the timeframe.
- Color: A bullish candle is typically green (or white) (close > open), while a bearish candle is red (or black) (close < open).
2. Types of Candlestick Patterns
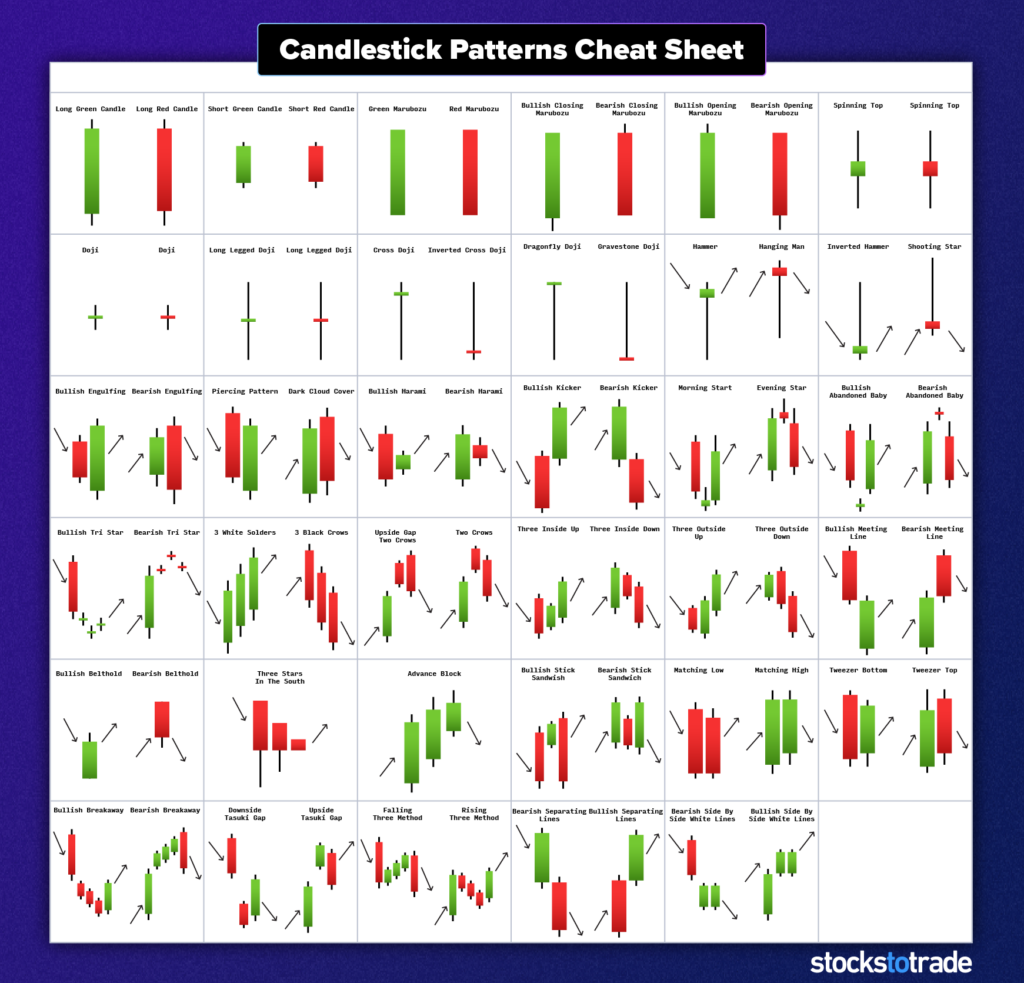
Candlestick patterns are categorized into reversal patterns, continuation patterns, and indecision patterns.
Reversal Candlestick Patterns
Reversal patterns indicate potential trend changes and are valuable for spotting market turning points.
1. Bullish Reversal Patterns
Hammer
- A small body with a long lower wick, appearing after a downtrend.
- Indicates buyers are stepping in, signaling a possible price reversal.
Bullish Engulfing
- A small red candle followed by a larger green candle that completely engulfs the previous one.
- Indicates strong buying momentum and potential uptrend continuation.
Morning Star
- A three-candle pattern: a large bearish candle, a small-bodied candle (indecision), and a strong bullish candle.
- Suggests a shift from bearish to bullish momentum.
2. Bearish Reversal Patterns
Shooting Star
- A small body with a long upper wick, appearing after an uptrend.
- Suggests buying momentum is weakening, and a price drop may follow.
Bearish Engulfing
- A small green candle followed by a larger red candle that engulfs the previous one.
- Signals increasing selling pressure and a possible downtrend.
Evening Star
- A three-candle pattern: a large bullish candle, a small-bodied candle (indecision), and a strong bearish candle.
- Indicates a transition from bullish to bearish sentiment.
Continuation Candlestick Patterns
Continuation patterns suggest that the current trend is likely to continue after a brief consolidation or pause.
1. Bullish Continuation Patterns
Rising Three Methods
- A long green candle, followed by three small red candles, then another strong green candle.
- Shows a brief pullback before trend continuation.
Bullish Flag
- A consolidation phase that forms a downward-sloping rectangle after an uptrend.
- Signals trend continuation when price breaks upward.
2. Bearish Continuation Patterns
Falling Three Methods
- A long red candle, followed by three small green candles, then another strong red candle.
- Indicates a minor bullish correction before trend continuation downward.
Bearish Flag
- A consolidation phase forming an upward-sloping rectangle after a downtrend.
- Signals trend continuation when price breaks downward.

Indecision Candlestick Patterns
Indecision patterns indicate market uncertainty and can lead to either trend continuation or reversal.
Doji
- Open and close prices are nearly identical, forming a small-bodied candle with long wicks.
- Represents market indecision, where neither buyers nor sellers dominate.
Spinning Top
- A small body with long upper and lower wicks.
- Suggests uncertainty and a possible trend reversal if confirmed by other signals.
Inside Bar
- A small candle completely contained within the previous candle’s range.
- Signals market consolidation before a potential breakout.
How to Trade Candlestick Patterns
1. Confirm with Volume
- A valid breakout or reversal pattern should be accompanied by high trading volume.
2. Combine with Other Indicators
- Use moving averages, RSI, or MACD to strengthen confirmation.
3. Set Stop-Loss and Take-Profit Levels
- Place stop-losses below support (for buys) or above resistance (for sells).
- Use previous highs/lows or Fibonacci levels to determine profit targets.
Example of Candlestick Pattern Trading
Example 1: Trading a Bullish Engulfing Pattern on Apple Stock (AAPL)
A trader spots a bullish engulfing pattern on AAPL’s daily chart near support.
Trade Execution:
- Entry: Buy AAPL at $150 after bullish confirmation.
- Stop-Loss: Placed at $145 to limit downside risk.
- Profit Target: Set at $165, previous resistance level.
- Exit: AAPL reaches $165, securing a $15 per share profit.
Example 2: Trading a Bearish Shooting Star on Bitcoin (BTC)
A trader sees a shooting star pattern on BTC’s 4-hour chart near resistance.
Trade Execution:
- Entry: Short BTC at $42,000 after rejection from resistance.
- Stop-Loss: Placed at $43,500 to limit risk.
- Profit Target: Previous support at $38,000.
- Exit: BTC drops to $38,000, securing a $4,000 per BTC profit.
Pros of Candlestick Pattern Trading
- Easy to interpret – Provides clear visual cues for reversals and continuations.
- Works across all timeframes – Suitable for intraday, daily, and swing trading.
- Can be used alone or with indicators – Enhances decision-making when combined with technical tools.
- Effective in all markets – Works in stocks, forex, and cryptocurrencies.
Cons of Candlestick Pattern Trading
- Requires confirmation – Candlestick patterns alone are not always reliable.
- False signals can occur – Not all patterns lead to expected price movements.
- Subjective interpretation – Some patterns can be misread without experience.
- Less effective in low-volume markets – Needs significant volume for confirmation.
When Should You Use Candlestick Pattern Trading?
- If you prefer visual, price-action-based trading.
- If you want early reversal or breakout signals.
- If you trade multiple asset classes and timeframes.
- If you can combine patterns with support/resistance, trendlines, and volume analysis.
Final Thoughts: Is Candlestick Pattern Trading Right for You?
Candlestick patterns provide deep insights into market sentiment and trader psychology, making them invaluable for spotting reversals, breakouts, and continuations. While they are powerful tools, traders must use confirmation techniques to avoid false signals.
For those who prefer a structured yet visually intuitive trading strategy, candlestick patterns offer a proven way to anticipate market movements.


